

1. Introduction
1) Children’s educational achievements and the importance of the neighborhood environment
2) The importance of children’s health and neighborhood environments
3) The social and economic status of children and the importance of their neighborhood environment
4) The importance of children’s safety and the neighborhood environment
5) COI 2.0 (Child Opportunity Index 2.0)
2. SKCOI 1.0(South Korea Child Opportunity Index 1.0) Pilot Construction and Application
1) Indicator setting
2) Indicators and KCO I 1.0 calculation method
3. Conclusion and Implications
1) SKCOI 1.0 policy application plan
2) Limitations of the SKCOI 1.0 and future tasks
1. Introduction
Childhood represents a period of rapid growth, and various studies highlight the importance of neighborhood environments during childhood. Chetty and Hendren (2018) demonstrated that the neighborhood environment significantly influences intergenerational social mobility during childhood, and Minh et al.(2017) stated that there is strong evidence showing that the social, economic, cultural, and architectural characteristics of a neighborhood lay important, lifelong foundations for children’s development. Moreover, neighborhood factors shape a child’s access to resources and experiences that promote healthy development. These factors mitigate risks that may impede child development through numerous multidimensional causal pathways (Noelke et al., 2020).
Besides socioeconomic and environmental studies, many physiological studies have stated that through biological embedding, children’s early social and environmental experiences shape their ‘health, learning, behavior, and well-being’ (Minh et al., 2017). Children’s early experiences vary based on their residential areas, leading to persistent health, social, and economic disparities extending into adulthood. This underscores the need for equitable neighborhood environments for all children.
Efforts have been focused on developing quantitative methodologies to quantify the level of opportunity within neighborhoods. This line of inquiry resulted in the creation of the Child Opportunity Index (COI) in the United States. The COI aims to raise awareness of the disparities in opportunities faced by children and serves as a tool to promote efforts towards a more equitable society where all children can thrive. Therefore, this study aims to develop a South Korean Child Opportunity Index (SKCOI) by applying the American Child Opportunity Index (COI) to South Korean context and utilize it to identify the imbalance of child opportunities in the South Korean region and propose policy efforts to improve it. This initiative represents the first step in precisely identifying the regional disparities in child opportunities within South Korea and facilitating tailored policy recommendations that align with the specific needs and characteristics of individual regions. Unlike previous studies that only considered fragmented factors affecting child growth and development, this approach takes into account a comprehensive set of factors, thereby significantly contributing to the search for solutions that are apt for the particular conditions of South Korea.
1) Children’s educational achievements and the importance of the neighborhood environment
Children share and grow through experiences with their peers and learn educational values under adult supervision. Burdick-Will et al.(2011) studied the influence of the social environment on educational outcomes. They found that children exposed to socially engaged and high-achieving peers, who could participate in productive study groups, showed improved academic achievement. They demonstrated that adults have the ability and willingness to monitor local neighborhood children, communicate the importance of schooling, and help them comply with community norms, which may vary regionally. Leventhal and Brooks-Gunn (2003) revealed that children and adolescents living in high-income neighborhoods had greater cognitive ability and academic achievement than those living in middle-income neighborhoods.
2) The importance of children’s health and neighborhood environments
It is generally understood that children’s health is closely related to the quality of their surrounding natural environment, particularly with regard to air quality and asthma. More importantly, while the surrounding natural environment affects children’s health, it also has a secondary effect; health status alters children’s academic ability according to their changing learning participation rate (Rungo, 2008). Moreover, it is essential to recognize that the surrounding social environment also impacts children’s health. Many studies on obesity (Saelee et al., 2020; Suglia et al., 2016), which are directly related to children’s health, have argued that the social environment around children also has a considerable influence on children’s obesity. Additionally, children’s mental health is impacted by the social environment (Rollings et al., 2017).
3) The social and economic status of children and the importance of their neighborhood environment
Ryabov(2020) demonstrated that neighborhoods partially account for the socioeconomic differences observed between racial/ethnic groups. Neighborhoods not only serve as residential areas but also promote geographically linked social interactions that influence specific behaviors, thus shaping the socioeconomic outcomes of residents (Ryabov, 2020). Noelke et al.(2020) demonstrated that neighborhood conditions are closely related to children’s socioeconomic status and can be indirectly influenced by adults who educate and supervise children.
4) The importance of children’s safety and the neighborhood environment
Katz et al.(2017) focused on children’s safety and well- being, utilizing neighborhoods as a unit of analysis. They demonstrated that neighborhoods directly or indirectly affected children’s safety and well-being.
5) COI 2.0 (Child Opportunity Index 2.0)
The COI 2.0, developed in 2020, is an advancement of the previous COI 1.0 (2014), incorporating additional items and new measurement methods. The COI 2.0 defines children’s opportunities as the neighborhood resources and conditions that are important for children’s healthy growth, such as good schools, healthy food, green space, clean air, adult educational attainment, and household structure, and it measures and evaluates these neighborhood resources and conditions.
The COI 2.0 includes 29 indicators comprising three categories: (1) education, (2) health and environment, and (3) social and economic. The selection of indicators for each domain was based on a comprehensive interdisciplinary literature review and additional information obtained from working with users of the COI 1.0 to identify key neighborhood characteristics related to healthy child development (Noelke et al., 2020). In the COI 1.0, each indicator was weighted equally, whereas, in the COI 2.0, each indicator was individually weighted according to how strongly it predicted children’s health and economic outcomes.
2. SKCOI 1.0(South Korea Child Opportunity Index 1.0) Pilot Construction and Application
1) Indicator setting
The SKCOI 1.0 was constructed by drawing reference from the COI 2.0 (Acevedo-Garcia et al., 2020) and comprises 30 indicators in four domains: (1) education: seven indicators; (2) health and the surrounding environment: eleven indicators; (3) socioeconomic environment: five indicators; and (4) safety: seven indicators. These indicators were selected based on their suitability and data availability within the South Korean context. The SKCOI values were derived from 37 types of available datasets, including national land indicator data, Korea Credit Bureau (KCB) big data, data processed through spatial analysis techniques, and data sourced by administrative district units. Four of the 30 indicators were calculated by adding weights to each sub-indicator and combining them. Accessibility indicators for parks and sports facilities were calculated by assigning equal weights to the detailed indicators of access to theme parks, living parks, and public sports facilities and then combining them with the same weights. The fine dust concentration indicator was derived by weighting the detailed indices of PM10 and PM2.5 concentrations at 0.4 and 0.6, respectively. The general medical accessibility indicator was calculated after assigning equal weights to each detailed index for hospital accessibility, clinic access, pharmacy access, and health institution accessibility. The detailed indicators for general hospital accessibility and emergency medical facility accessibility were given the equal weight, and then the comprehensive medical facility accessibility indicator was calculated. The same weighting method was applied for each indicator as the COI 1.0 method. Since the equal weight setting method can minimize the fundamental problem of inconsistency in the importance of various variables (Hagerty and Land, 2007), it possesses the strength to overcome challenges in setting weights for 30 or more indices.
(1) Education indicators
The education domain encompasses seven metrics: the proportion of regular teachers in kindergartens and elementary schools, access to kindergartens, elementary schools, libraries, performing arts facilities, daycare centers, and general social welfare centers (see Table 1). The ratio of regular teachers in kindergarten and elementary school is related to the teacher experience index from the COI 2.0 index. In South Korea, regular teachers tend to have more years of service and higher educational qualifications compared to temporary teachers(Ministry of Education, 2022), making the proportion of regular teachers a viable indicator for education domain.
Table 1.
Education indicators (7) of SKCOI 1.0
| Indicator | Definition | Space unit | Source |
Base year |
|
Percentage of regular kindergarten and elementary school teachers |
Percentage of regular teachers among all teachers (the sum of regular and fixed-term teachers) |
Administrative district |
Educational Development Institute Educational Statistics Service | 2022 |
| Kindergarten accessibility | Distance to the nearest kindergarten | 500M grid |
NLI(National Land Indicator)* for 2022 | 2022 |
|
Elementary school accessibility | Distance to the nearest elementary school | 500M grid | NLI for 2022 | 2022 |
| Library accessibility | Distance to the nearest library | 500M grid | NLI for 2022 | 2022 |
|
Performance culture facility accessibility | Distance to the nearest performance culture facility | 500M grid | NLI for 2022 | 2022 |
| Daycare accessibility | Distance to the nearest daycare center | 500M grid | NLI for 2022 | 2022 |
|
General Social Welfare Center accessibility |
Distance to the nearest general social welfare center | 500M grid | NLI for 2022 | 2022 |
Source: Shin(2022) revised by author.
*Indicators Constructed by the Korean Land Survey (The national land survey is conducted in six areas: ‘Population and Society’, ‘Land and Housing’, ‘Economy and Jobs’, ‘Life and Welfare’, ‘National Infrastructure’, and ‘Environment and Safety’. Based on the results, it builds and produces national land indicators).
The COI 2.0 states that the influence of adults with a high education level positively affects providing high expectations to children. Access to kindergarten, daycare centers, elementary schools, libraries, performance culture facilities, and general social welfare centers relates to the early childhood education center index of the COI 2.0 index. These metrics evaluate the surrounding facilities’ impact on educational opportunities, and the COI 2.0 cites a study by Chetty et al.(2018) that demonstrated that the surroundings’ influence in early childhood was greater than the their influence in adolescence; it emphasized the importance of neighboring facilities on education.
(2) Health and surrounding environment indicators
The health and surrounding environment indicator consists of 11 sub-indicators: access to parks and sports facilities, green area rate, fine dust concentration, ozone concentration, old housing ratio, EQ-5D, high-risk drinking rate, smoking rate, obesity prevalence, general medical accessibility, and comprehensive medical accessibility (See Table 2).
Table 2.
Health and surrounding environment indicators (11) of the SKCOI 1.0
| Indicator | Detailed Indicators | Definition | Space unit | Source | Base year |
|
Accessibility to parks and sports facilities | Theme park accessibility | Distance to the nearest theme park | 500M grid | NLI for 2022 | 2022 |
| Living area park accessibility | Distance to the nearest living area park | 500M grid | NLI for 2022 | 2022 | |
| Access to public sports facilities | Distance to the nearest public sports facility | 500M grid | NLI for 2022 | 2022 | |
| Green area rate | Ratio of area occupied by green areas in urban areas |
Administrative district | E-local indicator* | 2022 | |
|
Fine dust concentration | PM10 (fine dust) concentration | PM10 (μg/m3) concentration in the atmosphere | 1000M grid |
Based on the Air Korea data (point data for each measuring station), the one-day unit value is calculated using the Kriging method, following which the annual average is calculated. | 2019 |
|
PM2.5 (ultrafine dust) concentration | PM2.5 (μg/m3) concentration in the atmosphere | 1000M grid | 2019 | ||
| Ozone concentration | Ozone (ppm) concentration in the atmosphere | 1000M grid | 2019 | ||
| Old housing ratio |
Percentage of houses whose use approval has been passed for more than 30 years among the houses | 500M grid | NLI for 2022 | 2022 | |
|
EQ-5D (The closer score was to 1, the higher the quality of life) |
An indicator that combines the technical system of five dimensions of health-related quality of life (exercise ability, self-management, daily activities, pain/discomfort, anxiety/depression) |
Administrative district | E-local indicator | 2019 | |
| High-risk drinking rate |
Among those who drank in the past year, percentage of men who had seven or more drinks (or about five cans of beer) and women who drank more than five drinks (or about three cans of beer) at one drinking party twice a week |
Administrative district | E-local indicator | 2022 | |
| Smoking rate |
Percentage of current smokers among those who smoked five packs (100 cigarettes) or more in their lifetime |
Administrative district | E-local indicator | 2022 | |
| Obesity prevalence |
Percentage of people with a body mass index (kg/m2) of 25 or more (%), 19 years or older |
Administrative district | E-local indicator | 2019 | |
|
Accessibility to general medical care | Access to hospitals | Distance to the nearest hospital | 500M grid | NLI for 2022 | 2022 |
| Access to clinics | Distance to the nearest clinics | 500M grid | NLI for 2022 | 2022 | |
| Access to pharmacies | Distance to the nearest pharmacies | 500M grid | NLI for 2022 | 2022 | |
| Access to health institutions | Distance to the nearest health institutions | 500M grid | NLI for 2022 | 2022 | |
|
Access to comprehensive medical care |
Access to emergency medical facilities | Distance to the nearest emergency medical facilities | 500M grid | NLI for 2022 | 2022 |
| Access to general hospitals | Distance to the nearest general hospitals | 500M grid | NLI for 2022 | 2022 | |
Source: Shin(2022) revised by author.
*An index developed by the National Statistical Office of the Republic of Korea to identify the status of a region and the performance of local governments easily and conveniently, such as the degree of regional development and the quality of life of local people, and to make comparisons between regions.
The park and sports facility accessibility indicator correlates with the COI 2.0’s walkability metric, factoring in the limited outdoor spaces for children attributable to South Korea’s dense population and land usage. The significance of adequate outdoor activities for children is mentioned in many studies (Bento and Dias, 2017; Frost and Sutterby, 2017), emphasizing the importance of space for outdoor activities. Additionally, park and sports facility accessibility were selected as indicators because they can serve as spaces for children and parents to share, holding significant meaning for children’s healthy physical and mental development.
The green space rate indicator pertains to the access to green space from the COI 2.0 indicator. The COI 2.0 references Bell et al.(2018) and Kowaleski-Jones et al.(2017) to highlight the connection between access to green spaces and increased physical activity, enhanced mental health, and decreased stress among children.
Fine dust and ozone concentrations are indicators associated with airborne micro particles, and ozone concentration from the COI 2.0 indicator and the COI 2.0 suggests that these indicators negatively affect health and education outcomes. In the COI 2.0, the fine dust index consisted of only ultrafine dust (PM2.5), but in the SKCOI 1.0, referring to the results of many studies that have demonstrated that fine dust (PM10) has a negative effect on children’s health (Mahapatra et al., 2020; Zhang et al., 2020), these two atmospheric pollutants were combined as one fine dust indicator. In general, since it is known that the risk of ultrafine dust (PM2.5) is greater than that of fine dust (PM10), the weight of ultrafine dust (PM2.5) (0.6) is higher than that of fine dust (PM10) (0.4).
The old housing ratio index relates to the index of housing vacancy rate from the COI 2.0. Branas et al. (2018), Laurito et al.(2019), and Sharkey(2010) have demonstrated that vacant houses are related to a decrease in children’s sense of safety and an increase in the crime rate. Consequently, in the SKCOI 1.0, the old housing ratio was selected as a factor that jeopardizes the development of healthy children and was used as an indicator.
EQ-5D, high-risk drinking rate, smoking rate, and obesity prevalence indicators are not directly included in the COI 2.0. In the SKCOI, indicators were established based on the influence of healthy adults (EQ-5D) on children and the potential harm from adult behaviors, such as non-excessive drinking, smoking, and obesity prevalence. Accessibility to general and comprehensive medical care serves as an indicator of children’s access to medical care. These indicators were also not directly included in the COI 2.0.
(3) Socioeconomic environment indicators
The socioeconomic environment indicator consists of five sub-indicators: the suicide rate per 100,000 population, the ratio of workers in the specialized science and technology industry (70–73), monthly average income, crude divorce rate, and financial independence (see Table 3).
Table 3.
Socioeconomic environment indicators (5) of SKCOI 1.0
Source: Shin(2022) revised by author.
Table 4.
Safety indicators of SKCOI 1.0 (7)
Source: Shin(2022) revised by author.
The ratio of workers in the specialized science and technology industry (70–73), the monthly average income, and financial independence indicators are related to ‘high- skill employment’, ‘median household income’, ‘poverty rate’, ‘public assistance rate’, and ‘homeownership’ from the COI 2.0 indicators; in the COI 2.0, they are combined as the ‘economic resource indicator’. In presenting this indicator, the COI 2.0 states that economic resources are closely related to social resources that affect children’s development and educational, economic, and health outcomes. In the SKCOI 1.0, due to the potential distinction and lack of clear correlation between high-skill employment, monthly average income, and financial independence, each was established as an independent metric. In particular, high-skill employment and average monthly income affect the purchasing power for service goods related to the healthy growth of children, and financial independence is related to supply power improvements for public service goods; therefore, it is reasonable to set this as an indicator.
The crude divorce rate aligns with the COI 2.0’s single- headed households indicator (percentage of single-parent households). The COI 2.0 incorporates this metric because a higher proportion of single-parent households signifies a diminished parental role.
(4) Safety indicators
The safety index comprises seven indicators: crime safety, fire safety, Traffic safety, life safety grades, outdoor earthquake shelters, police station, and fire station accessibility (see Table 4). While the COI 2.0 does not include a safety domain, it indirectly reflects safety concerns through the housing vacancy rate. The developers of the COI 2.0 argued that data, such as crime rates significantly impact children’s safety. They mentioned that the absence of a crime rate indicator in COI 2.0 is due to the impossibility of obtaining nationwide data under uniform conditions (Acevedo-Garcia et al., 2020). In the South Korean context, data for the regional safety index can be sourced from the Ministry of Security and Public Administration. Additionally, data on accessibility to earthquake outdoor shelters, police stations, and fire stations are available from the 2022 National Land Indicator. Consequently, these data were incorporated as indicators. While South Korea has not yet experienced significant damage or risk from earthquakes, the current situation, marked by an increased frequency of minor earthquakes, suggests that it cannot be considered a completely safe zone from seismic events. Therefore, the accessibility of earthquake outdoor shelters can serve as a safety indicator.
The Regional Safety Index, released by the Ministry of Security and Public Administration, refers to the level of safety of each local government. It has been published annually since 2015, covering six fields: traffic accidents, fires, crimes, life safety, suicide, and infectious diseases. The SKCOI 1.0 constructed indicators using the four categories: fires, crimes, traffic accidents, and life safety. These categories were selected considering their relevance to children’s safety and redundancy with other indicators.
2) Indicators and KCO I 1.0 calculation method
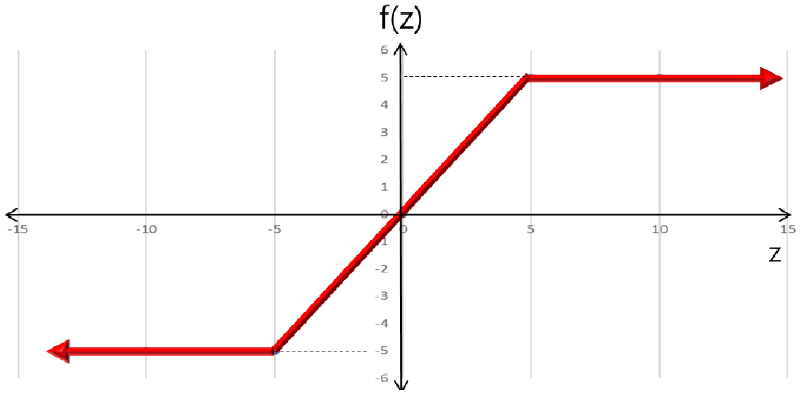
As the unit of measurement for each indicator is different, all indicators are calculated through standardization (Equation 1) in the same way as the COI 2.0:
Here, z is the standardized value, Χ is the indicator value, μ is the average of the indicator values, and s is the standard deviation.
For the SKCOI 1.0, outlier values were adjusted using a method similar to the fuzzy function applied in the COI 2.0. Based on the standardized value (Z-score), values above 5 are 5, and below -5 are –5(see Fig. 1).
Since the indicators’ values used in calculations are standardized, if the original data values of all indicators are equal to the mean, the sum of all standardized indicators is zero. By adding a constant of 100 to the sum of the standardized indicators(Equation 2), we can interpret SKCOI 1.0 scores around 100 as either below or above average. Theoretically, SKCOI 1.0 values can range from a maximum of 250 points to a minimum of -50 points. Finally, the SKCOI 1.0 is classified into ten grades (Grades 1–2: Very High, Grades 3–4: High, Grades 5–6: Moderate, Grades 7–8: Low, Grades 9–10: Very Low) according to the size of the value.
Here, k = region, i = domain, j = Indicator of the i domain, m = number of domains, n = number of indicators in i domain
(1) Education domain
The indicators’ calculation for education indicates a marked difference between the special metropolitan areas and the general cities and provinces (see Fig. 2(a)). In the education domain, very high grades appeared primarily in the Seoul Special City and Incheon Metropolitan City, several areas in Busan, Daegu, and Gwangju Metropolitan Cities. Conversely, deficient grades were primarily found in Gangwon and Gyeongbuk province, Yeong-honam’s inland and southwestern coastal zones, with low grades distributed in the surrounding areas.
The degree of disparity in the results for the education domain indicators, as measured by the Theil index, indicates that among the seven indicators, the highest degree of disparity is observed in access to day care centers (0.080), followed by access to elementary schools (0.069), and access to kindergartens (0.065). This suggests that public sector measures to develop these facilities are necessary.
(2) Health and surrounding environment domain
The indicators for health and the surrounding environment, similar to the results in the education indicators, demonstrate striking differences between special metropolitan areas and general cities and provinces (see Fig. 2(b)). Seoul, Gyeonggi Province, Busan, Ulsan, Daejeon, and Daegu predominantly recorded very high grades. Conversely, very low grades were conspicuous in Gangwon and Gyeongbuk provinces’ coastal areas, in some inland areas of Yeong-honam, the southwest coast zones, and in northwestern Chungnam and northern Chungbuk provinces.
The degree of imbalance for health and surrounding environment domain indicators, as measured by the Theil index, indicates that the ratio of aged housing (0.124) demonstrated the highest gap, followed by smoking rate (0.095), general medical accessibility (0.094), obesity prevalence (0.094), fine dust concentration (0.081), and EQ-5D (0.061). These findings highlight the need for public policies addressing urban environmental concerns, atmospheric management, and public health.

(3) Socioeconomic environment domain
The socioeconomic environment indicators do not exhibit a significant difference between the special metropolitan city area and the general city province area, as depicted in Fig. 2(c). In the Gyeonggi province adjacent to southern Seoul special city, Seoul special city, some areas in the central region, and certain areas in Honam and Yeongnam regions, were very high-grade regions, demonstrate a difference from the results of the education and health and surrounding environment indicators. This result appears to have great implications for social policy.
The degree of imbalance in the socioeconomic environment domain indicators, as measured by the Theil index, indicates that the ratio of professional science and technology workers (70–73) (0.348), average monthly income (0.148), and financial independence (0.082) as economic indicators is much greater than social indicators, such as the suicide rate per 100,000 population (0.049) and crude divorce rate (0.065). These results suggest that policy efforts for economic imbalances should be prioritized.
(4) Safety domain
Safety indicators differ between special metropolitan cities and general city province areas (See Fig. 2(d)). Very high grades were evident in Seoul Special City and Gyeonggi Province, adjacent to Seoul, as well as in Daegu, and Busan Metropolitan Cities. However, similar to the results in other domains, very low grades were prominent in Gangwon and Gyeongbuk Provinces, in some inland areas of Yeong-honam, and in the southwest coast zones.
The imbalance degree for safety indicators, as measured by the Theil index, indicates that the degree of disparity for crime (0.105), life safety (0.097), fire (0.096), and traffic safety (0.094) ratings is similar and higher than that for police station accessibility (0.057), fire station accessibility (0.050), and outdoor earthquake shelter (0.005) indicators. This finding suggests that more efforts are needed for safety in public areas such as crime, life safety, fire and traffic safety.
(5) SKCOI 1.0 results
Fig. 3(a) illustrates the SKCOI 1.0 calculation result, which represents the sum of all indicator scores. Very high and high grades center on the capital area and Metropolitan Cities. However, in Gangwon, Chungbuk, and Gyeongbuk provinces, Yeong-honam inland, and southwest coastal regions, very low- and low-grade regions are found, demonstrating the regional imbalance in child opportunities between special metropolitan and general cities and provinces. In particular, the inequality of children’s opportunities between the metropolitan and non-metropolitan areas is striking (see Fig. 3(b)).

The degree of disparity in the socioeconomic domain (0.126) is the most significant, followed by the education (0.098), safety (0.088), and health and surrounding environment (0.068) indicators. These findings indicate that policy efforts to resolve the imbalance of children’s opportunities should first focus on socioeconomically related areas.
3. Conclusion and Implications
Through developing the SKCOI 1.0 index, the regional imbalances in South Korean neighborhood conditions for healthy child growth were evident between special metropolitan cities and general cities and provinces, especially between metropolitan and non-metropolitan areas. At the central government level, policy efforts should focus on mitigating regional imbalances between metropolitan city areas, centering on capital and local metropolitan areas and small and medium-sized cities. At the local government level, targeted initiatives are needed to address sector-specific imbalances in opportunities.
1) SKCOI 1.0 policy application plan
The importance of the healthy growth for children, who bear responsibility for the future, cannot be overemphasized. South Korea lacks systematic data and monitoring methods regarding neighborhood conditions for child growth. Consequently, identifying and addressing regional disparities in these conditions has been challenging. The SKCOI 1.0 is the first index in South Korea that measures regional opportunities for children’s growth. The SKCOI 1.0 offers detailed insights into four crucial domains: education, health and surrounding environment, socioeconomic environment, and safety. These domains highlight regional areas of concern. It can play an instrumental role in formulating specific and actionable policies to improve local conditions for the healthy growth of children. Additionally, in a context where some of Korea's child policies have been criticized for focusing on short-term achievements at the expense of long-term strategies to support children's growth and development, the SKCOI 1.0 will serve as a pioneering step towards establishing a continuous support system from early childhood through to adolescence.
2) Limitations of the SKCOI 1.0 and future tasks
A key advantage of the SKCOI 1.0 is its ability to verify local conditions with greater precision than the COI 2.0, thanks to the inclusion of safety indicators. However, limitations in its data acquisition methods create a significant weakness: it cannot represent neighborhood conditions as effectively as the COI 2.0 due to a lack of indicator composition across various domains.
Specifically:
Education: The SKCOI 1.0 lacks metrics for neighborhood educational performance (such as student reading/math abilities and college enrollment rates). This omission weakens its explanatory power within the education domain.
Health and Environment: Unlike the COI 2.0, the SKCOI 1.0 fails to include indicators for hazardous waste treatment plants and industrial pollutants, which directly impact children’s health. This weakens its ability to assess environmental health risks.
Additionally, the SKCOI 1.0 applies the same weighting method to all indicators, preventing it from assigning varying levels of importance and further weakening its explanatory power.
To enhance the utility of the index, SKCOI 2.0 should focus on:
Data Expansion: Acquiring more data and developing alternative indicators to address the weaknesses identified in version 1.0.
Improved Weighting: Adopting COI 2.0 weighting method to add greater depth and nuance to the index.
