

1. Introduction
2. Data and Methodology
3. The Change of Compound Extreme Heat Events (1973-2025)
4. Future Projection of Compound Extreme Heat Events (2021-2100)
5. Summary and Discussion
1. Introduction
Shifts in temperature driven by global warming have led to greater frequency and intensity of heat extremes, intensifying negative impacts on both nature and human society (Diffenbaugh et al., 2017; Perkins-Kirkpatrick and Lewis, 2020; Seneviratne et al., 2021; Vicedo-Cabrera et al., 2021). Without the drastic reduction of greenhouse gas emissions and appropriate adaption policies, these impacts are projected to escalate in the future, leading to irreversible changes (Solomon et al., 2009; Grant et al., 2025). Extreme heat conditions directly affect the society by increasing risks of heat-related illnesses and mortality (Raymond et al., 2020; Matthews et al., 2025; Pineda-Moncusí et al., 2025), energy consumption for cooling (Lee et al., 2014; Auffhammer et al., 2017), and threatening food security (You et al., 2025; Ahmed et al., 2026). Thus, understanding the mechanism underlying extreme heat conditions is important. Furthermore, their impacts can be further amplified when they are coupled with other climatic extremes, such as drought, cyclone, extreme precipitation, a concept known as compound event (Zscheischler et al., 2018; AghaKouchak et al., 2020). Specifically, prolonged heat conditions are categorized as temporally compounding events (Baldwin et al., 2019; Zscheischler et al., 2020), and these extended extremes have led to a significant increase in thermal risks (Conti et al., 2005; Hoffmann et al., 2008).
The seasonal climate patterns of the Republic of Korea (ROK) are primarily influenced by the East Asian Summer Monsoon (EASM), characterized by highly concentrated summer rainfall. These precipitation patterns result in very hot and humid summer, which raise human-sensible temperature (Li et al., 2018; Choi and Lee, 2020). However, they limit successive extreme heat conditions, as the rainfall causes the temperature to drop (Liu et al., 2022). Nevertheless, an overall increase in temperatures has been observed in the ROK (Choi et al., 2023), which has potentially escalated the occurrence of successive heat events (Chiang et al., 2022). The heat events in the ROK are influenced by some large-scale atmospheric patterns, including EASM, Arctic Oscillation, and El Niño Southern Oscillation. Through complex mechanisms, these patterns have facilitated the formation of persistent high pressure that ease the occurrence of extreme heat events, occurring more frequently since the mid-1990s (Lee and Lee, 2016). Consequently, prolonged extreme heat conditions are strengthening in the ROK accompanied by rising potential risks.
Korea Meteorological Administration (KMA) has employed diverse high-temperature related indicators, including hot day, duration of warm days, tropical night, highest maximum and minimum temperatures, and length of summer (https://climate.go.kr/home/). However, as they are limited in illustrating single aspect, such as frequency, duration or intensity, it is difficult to detect compound events and moreover, underestimate the real impact of those phenomena (Zscheischler et al., 2018). Thereby, it is essential to develop compound extreme indices that can comprehensively characterize shifting climatic physical responses in diverse perspective (Wang et al., 2020; Hess et al., 2023). Studies investigating impacts of temporally compounding extreme heat events are increasing. Wang et al. (2020) defined ‘hot day-hot night’ events and analyzed their frequency and intensity across the Northern Hemisphere, using the excess temperature above the 90th percentiles. Wu et al. (2023) classified heatwaves into independent and compound heatwaves on a global scale, and examined their physical mechanism. Liu et al. (2025) analyzed day-night compound heatwaves and found that they significantly increase mortality risks. Wu et al. (2025) identified future heat-related mortality in Europe that is associated with consecutive compound day-night heat extremes. While in the ROK, Choi (2025) examined the characteristics of persistent tropical nights, focusing on consecutive hours and cumulative temperatures. Kyoung et al. (2025) used indices illustrating compound heat events in Ulleungdo, while Baek and Lee (2024) evaluated how heatwave persistence impacts the heat-related illness. Developing adequate indicators that capture current shift in extreme conditions, alongside a detailed examination of their spatial distribution, is crucial for minimize the impacts of climatic extremes, as societal adaptability largely depends significantly on regional geographical characteristics (Eltahir and Choi, 2025). Thus, this study aims to examine the characteristics of continuous heat events in the Republic of Korea by defining two newly developed indicators, Consecutive Heat Event (CHE), and Heatwave (HW), specifically considering their intensity and duration.
2. Data and Methodology
Daily maximum and minimum temperature from 1973 to 2025 provided by KMA were used to assess extreme heat conditions in the Republic of Korea. A total of 60 Automated Synoptic Observing System (ASOS) weather stations were selected, as they provide high-quality data in a relatively long-term period (Figure 1). Same climatic variables were employed for future projections, by utilizing five high-resolution (1km x 1km) Regional Climate Models (RCMs), which are the Consortium for Small-Scale Modeling-Climate Limited-area Modeling (COSMO-CLM or CCLM), Global/Regional Integrated Model system (GRIMs), Hadley Centre Global Environment Model version 3 Regional Climate Model (HadGEM3-RA), Regional Climate Model version 4 (RegCM4), and Weather Research and Forecasting (WRF), under four Shared Socioeconomic Pathways (SSPs) spanning from 2021 to 2100. These datasets were produced by dynamically downscaling a CMIP6 Global Climate Model (GCM), UKESM1, with bias correction applied during the downscaling process, and subsequently refined to a 1 km spatial resolution (KMA, 2023). The simulation characteristics of each RCM are described in Kim et al. (2022). Based on the geographical coordinates of 60 weather stations, the corresponding grid cells were selected using centroid method. Two new indicators for each model were calculated separately and then averaged to produce a multi-model ensemble mean.
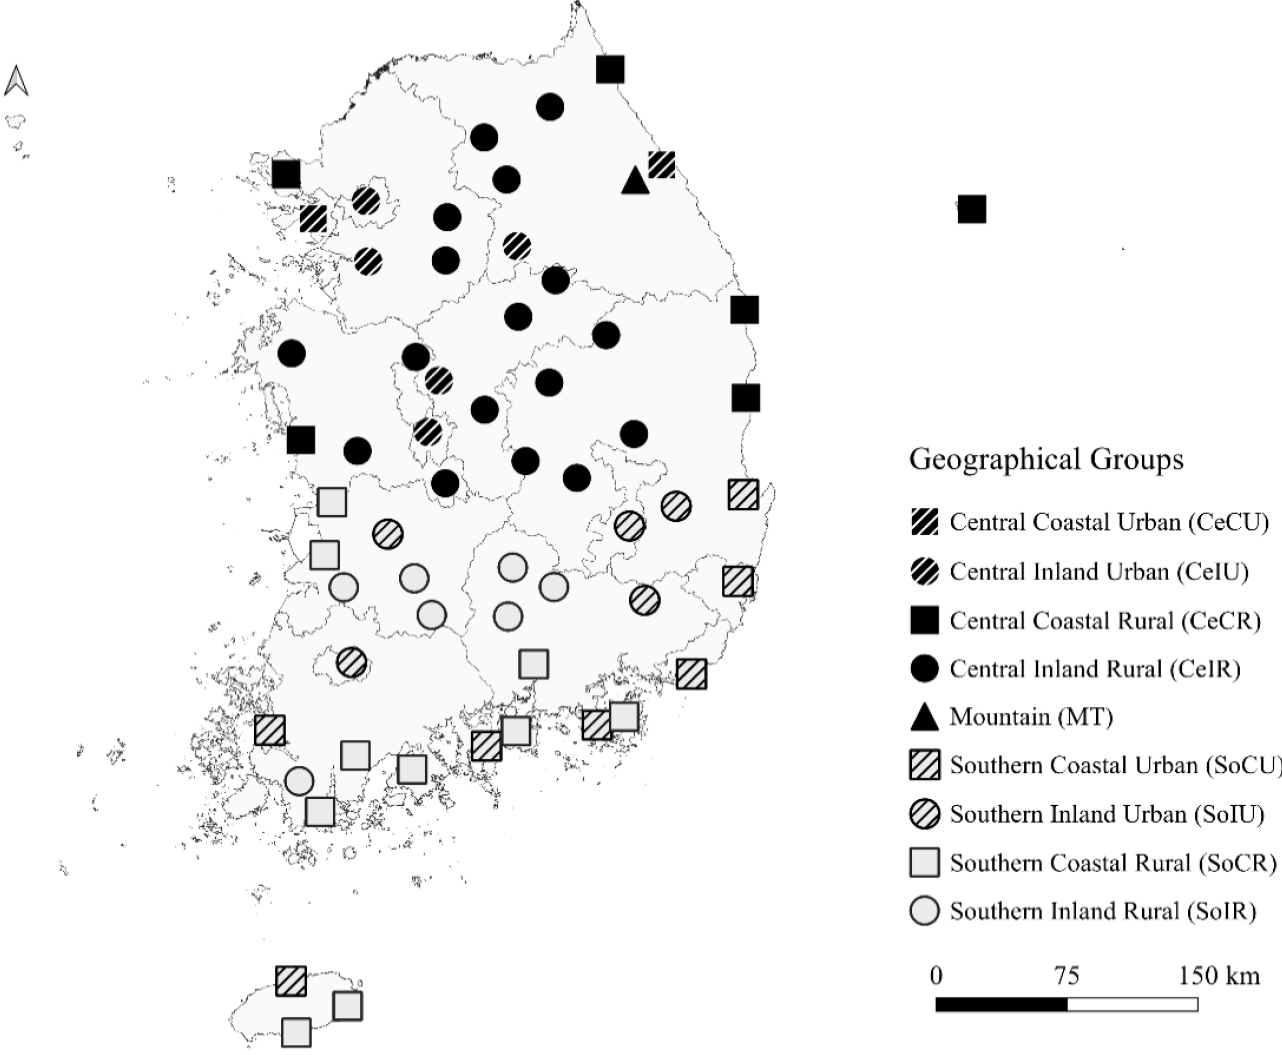
Three geographical factors (elevation, distance from the coast, urbanization level) based on the study of Min et al. (2024) were used to categorize weather stations in the Republic of Korea as mountainous/plain, inland/coastal, and urban/rural areas. Following the criteria of Min et al. (2024), 35 stations were categorized as inland areas and 25 as coastal areas, 19 and 41 stations divided as urban and rural areas, respectively, and only one station was assigned to the mountainous region. In addition, this study incorporated latitude as a geographical factor, that leads to a distinctive spatial thermal distribution. Based on the mean latitude of 60 stations, 31 stations were assigned to the central region (above the mean latitude), while other 29 stations to the southern region (below the mean latitude). Collectively, the weather stations were assigned to nine distinct groups (Central Coastal Urban, Central Inland Urban, Central Coastal Rural, Central Inland Rural, Mountain, Southern Coastal Urban, Southern Inland Urban, Southern Coastal Rural, Southern Inland Rural), as shown in Figure 1 along with their abbreviations.
We utilized two existing hot extreme indicators, Hot Day (HD) and Tropical Night (TR) to develop two new indicators, which are Consecutive Heat Event (CHE) and Heatwave (HW) (Table 1). In this study, the definition of HD used in the 27 extreme climate indicators established by the KMA was adopted. For TR, the definition provided by the Expert Team on Sector-specific Climate Indices (ET-SCI) was utilized, with the reference threshold modified from exceeding 20°C to 25°C or higher (https://climpact-sci.org). CHE is defined as when a HD occurs, followed by a TR and another HD on the subsequent day. In other words, the sequence of “HD-TR-HD” is required for a CHE to occur. Daily minimum temperature mostly occurs around sunrise, TR on the following day was used to identify continuous heat events. When two or more successive CHEs occur, the event is classified as HW. Since minimum of two CHEs is required, the minimum duration of a HW is three days. Wu et al. (2023), also defined a compound heatwave as the period of at least three consecutive days with both daily maximum and minimum temperatures exceeding thresholds.
Table 1.
Definitions, characteristics, calculation methods, and units of heat indicators selected for the study
We first calculated the annual frequency, intensity, severity, and durations of compound events at the individual station, then, we averaged 60 stations to give national mean values. The annual occurrence of CHE and HW was calculated as the frequency. The CHE intensity was calculated as the sum of differences between the threshold temperatures and the occurred temperatures during the event (Equation 1). This quantitatively express the thermal stress imposed to human body (Kim and Choi, 2017; Kim and Choi, 2020; Wang et al., 2020). Total sum of annual CHE intensity was divided by the CHE frequency to calculate annual CHE mean intensity.
Where is the daily maximum temperature on the starting day of the event, while and are the daily maximum and minimum temperature of the subsequent day, respectively.
When analyzing HW, severity and maximum duration were utilized. Severity is measured by the highest maximum and minimum temperatures during HW, and maximum duration as the longest HW length within a year, which it was employed to analyze the persistence of compound extreme heat events.
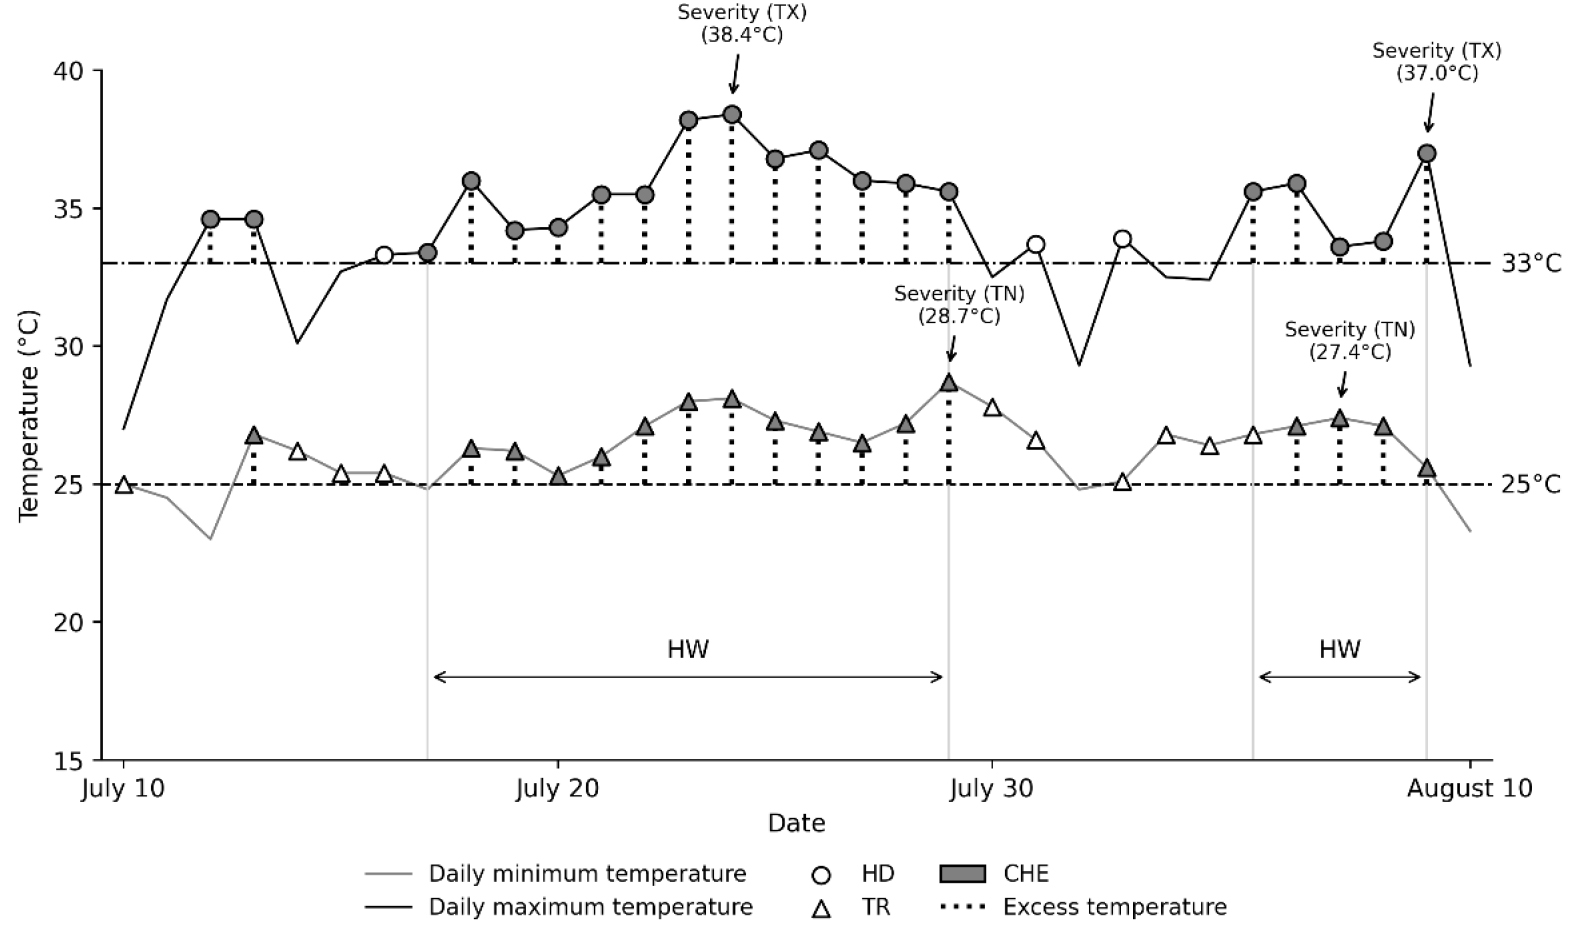
For instance, the daily maximum temperature in Seoul on July 12, 1994, was 34.6°C. On the subsequent day, the daily minimum and maximum temperatures was recorded at 26.8 and 34.6°C respectively, resulting in HD on both days and TR on July 13 (Figure 2). This HD-TR-HD sequence was classified as a CHE, with an intensity of 5°C. Likewise, on July 17, HD followed by TR and another HD on the next day, leading to the occurrence of CHE. As these conditions persisted until July 29, occurred 12 CHEs were identified as one HW with duration of 13 days. This HW ended as the daily maximum temperature on July 30 fell below 33°C. Similarly, from August 5 to 9, where five HDs and four TRs occurred consecutively, four successive CHEs and HW with duration of five days were identified. The TX and TN severity of the first HW was 38.4 and 28.7°C, respectively, whereas it was 37.0 and 27.4°C, respectively in the second HW. Both TX and TN severity was higher in the first HW, and combined with its longer duration, resulted in more intense extreme heat condition than the second HW.
After the calculation, the significant change of each indicator was identified. In this step, non-parametric Mann-Kendall test was used to assess trend significance and Sen’s slope estimator to calculate the changing rate. For the calculation of the annual average values, we followed the statistical guidelines provided by KMA (2021). While for the distributional analysis of different groups, we utilized the median along with the interquartile range. Percentile based thresholds were defined based on the 1991-2020 period, with calculations performed individually for each station.
3. The Change of Compound Extreme Heat Events (1973-2025)
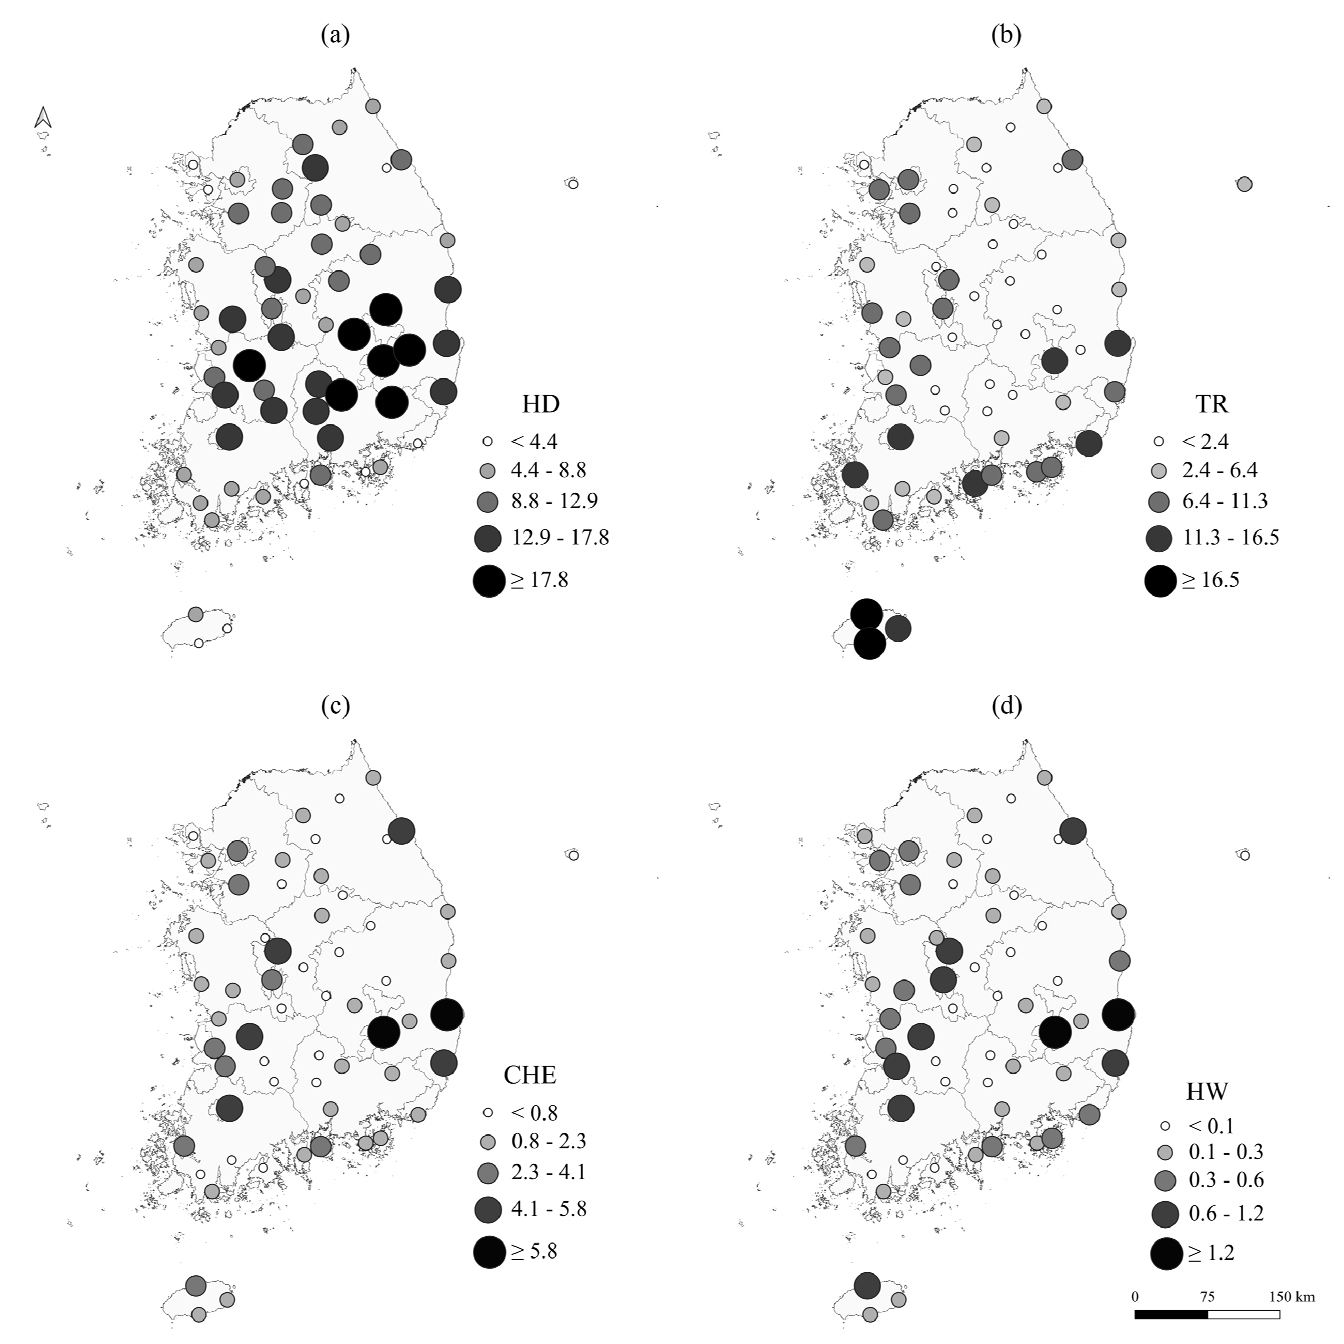
The spatial distributions of four heat-related indicators are shown in Figure 3. HD occurred most frequently in southern-east inland regions since these regions normally exhibit drier atmospheric condition which enable fast atmospheric heating. In contrast, TR was more concentrated in coastal regions affected by the maritime effects or urban areas due to the Urban Heat Island (UHI) effects, both of which inhibit nocturnal cooling (Chow and Svoma, 2011). As the development of compound heat events requires simultaneous occurrence of both HD and TR, regions where both HD and TR occurred in moderate and balanced proportions showed high frequency of consecutive heat events. Looking at spatial distribution, HD was relatively distributed uniformly, whereas TR was more concentrated in certain regions, and thereby TR might play more dominant role than HD in the spatial distribution of consecutive heat events. Since TR occurred predominantly in urban and coastal areas, CHE and HW was also occurred more frequently in these regions, with southern areas generally exhibiting higher frequency.
Due to the faster increase in minimum temperature than maximum temperature (NIMS, 2018), the change in TR was more pronounced than that of HD. A larger number of stations showed significant trends in TR, and a steeper upward trend was detected at the national level (Table 2). This trend is also expressed by the differences between 53-year mean and recent decadal values. Relative to 53-years mean, HD frequency was 67.0% higher during the recent decade, whereas in case of TR, this value was 110.0%.
Table 2.
Statistical summary of national mean values and regression coefficients (p < 0.01), along with the number of stations exhibiting significant increasing trends (p < 0.05), 1973-2025.
Despite fewer stations showing significant trends in HD (34 stations), the noticeable intensification of TR (52 stations) facilitated the occurrence of combined heat conditions. Thereby, even without increase in HD, more stations experienced significant increases in the frequencies of CHE (49 stations) and HW (36 stations). The growth rates of the recent decadal means relative to 53-year averages were even more substantial, with CHE and HW frequencies increasing by 164.7% and 200.0%, respectively. These large gaps illustrate the historical rarity of compound extreme heat events, which have recently become increasingly common. While TR and HD are relatively familiar extreme heat conditions in the ROK, CHE and HW are newly emerging climatic threats that will impose unprecedented thermal stress on the people and ecosystem.
A similar number of stations to the frequencies showed significant increasing trends in CHE mean intensity (50 stations), TX (34 stations) and TN (38 stations) severity of HW, and maximum HW duration (38 stations). In the case of CHE, all stations showing a significant trend in frequency also showed a significant increase in intensity. In contrast, for HW, 29 of the 34 stations exhibiting significant trends in TX severity were the same as those exhibiting significant changes in HW frequency, while 27 stations overlapped for TN severity and maximum HW duration. These results suggest that increased occurrence of compound extreme heat events were closely linked to the concurrent increases in intensity, severity and duration. Furthermore, the increasing rates of these metrics over the recent decade have exceeded 100% compared to the 53-year mean, highlighting recent intensification of compound extreme heat conditions. Although the TR showed more pronounced increase than HD, the national regression coefficient was greater in TX severity (1.96°C decade-1) than in TN severity (1.50°C decade-1). These results suggest that while minimum temperatures exhibit a more distinct shift in mean conditions, maximum temperatures may show a more substantial changes in terms of extreme conditions.
The occurrence patterns of the four indicators (HD, TR, CHE, HW) were similar, showing prominent peaks in 1994, 2018, and 2024 (Figure 4a). In particular, the peak in 1994 was noticeable as it stood out against the relatively low frequencies of heat events in the surrounding years. Compound extreme heat events can occur when both maximum and minimum temperatures remain concurrently elevated, and driven by robust warming trends, such simultaneous climatic conditions have been facilitated (Wang et al., 2020). Since 2010, the frequency of compound extreme heat events has increased notably, with higher intensity and duration. Quantitatively, since 2010, 12 out of 16 years experienced CHE and HW frequencies exceeding the 53-year average. In contrast, prior to 2010, only four years for CHE and six years for HW surpassed this same averaged frequency.
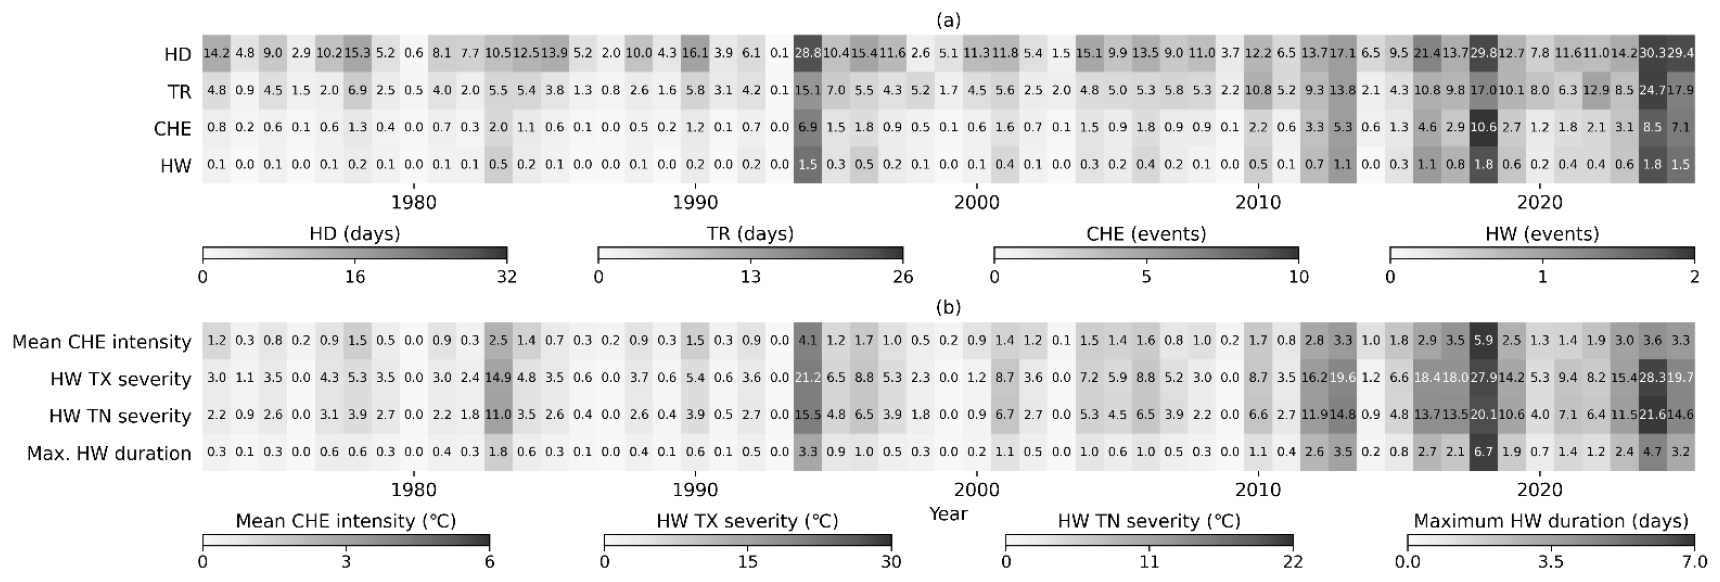
In years with a high occurrence of compound extreme heat events, elevated levels of intensity, severity, and duration were observed. Parallel to the frequency trends, the intensity, severity, and duration also intensified after the 2010s. For mean CHE intensity, and both TX and TN severity, only seven years surpassed the 53-year averaged value before 2010, whereas 12 years have shown higher value after 2010. Similarly, HW maximum duration surpassed 53-year mean in 12 years since 2010, compared to only four years before 2010.
Based on Min et al. (2024), station with an elevation of 300m or higher above sea level is classified as mountainous area, and only Daegwallyeong met this criterion. Generally in mountain regions, extreme heat events are rare due to the elevation, and thus, they expect to experience lower risk of extreme heat. Likewise, no TR was observed throughout the study period in Daegwallyeong, which subsequently led to zero occurrence of either CHE or HW. However, the occurrence of six HDs in 2025, attributed to global warming, highlights the potentiality of compound extreme heat in mountain regions if no mitigation occur.
The urban groups consistently showed higher frequency, intensity, and duration of compound extreme heat events compared to rural (Figure 5). All urban groups exhibited higher median values than 60-station mean, where all rural groups showed lower medians. This is primarily induced by combined effects of intense daytime heating and Urban Heat Island (UHI) effect which interrupts nocturnal cooling. UHI effect is marked by distinctively higher temperatures in urban areas than in surrounding rural areas, which is driven by low albedo of urban surfaces, the presence of tall structures that trap heat, and the concentrated anthropogenic heat from dense populations (Oke, 1982; Erell and Williamson, 2007; Bohnenstengel et al., 2014). Among urban groups, southern inland urban group (SoIU) were ranked highest in both CHE and HW frequency, whereas for intensity and duration, central coastal urban group (CeCU) was highest. While SoIU experienced more frequent occurrence of compound extreme heat events, CeCU was exposed to relatively less, but stronger and more prolonged extreme heat conditions. These varying rankings among urban regions are due to the dominant UHI effect, that overshadows the influences of other geographical features.
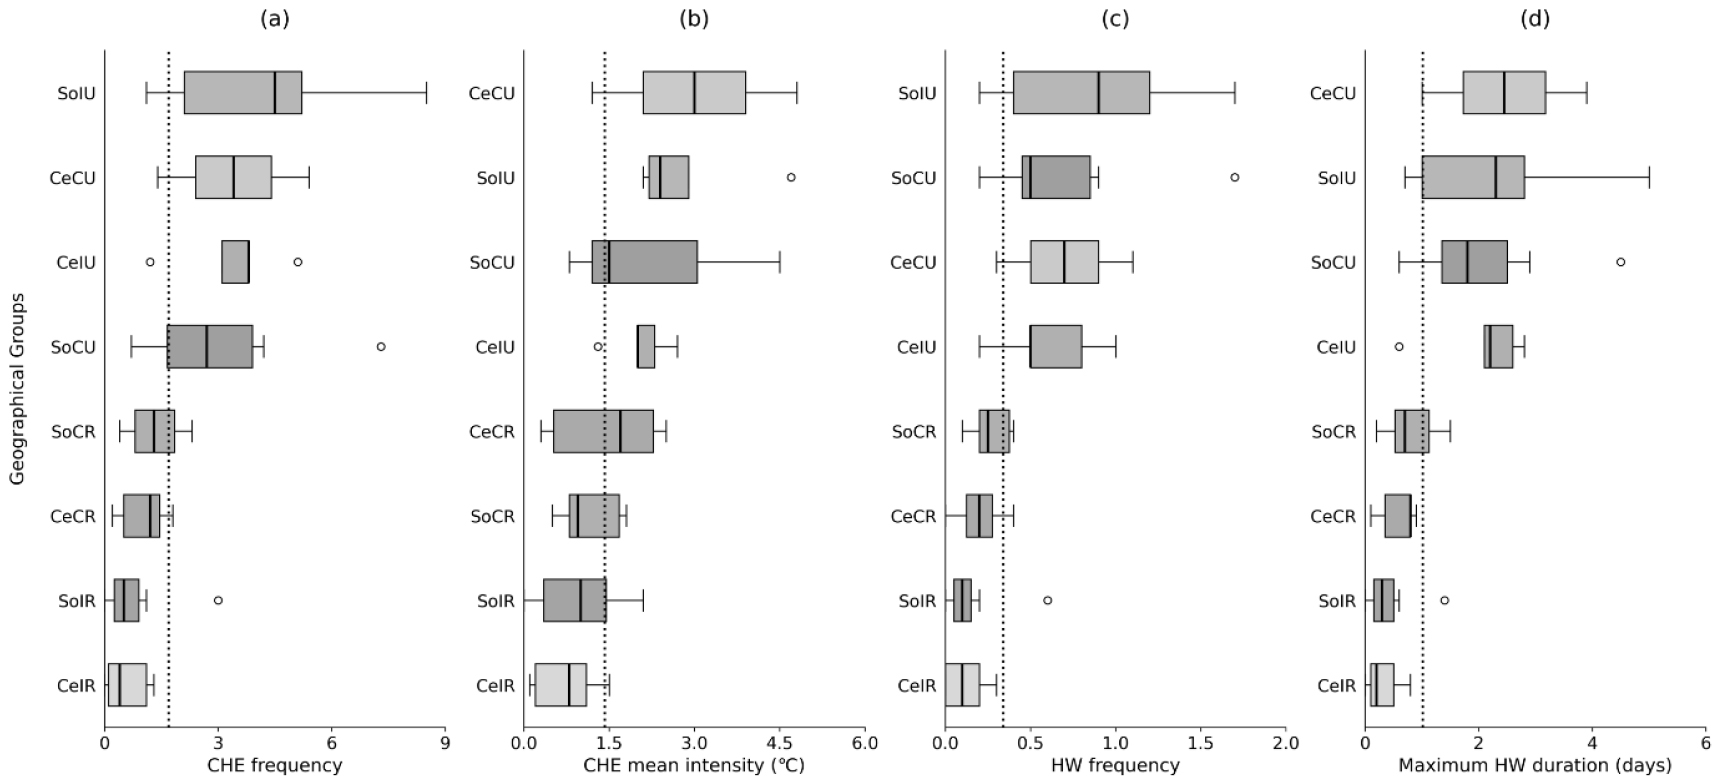
Figure 5.
53-years averaged annual (a) frequency of CHE, (b) mean intensity of CHE, (c) frequency of HW and (d) maximum HW duration for nine geographical groups, 1973-2025. The dotted vertical lines represent the average values for 60 stations, and the groups are ordered based on the magnitude of their mean values. Each box extends from the first quartile to third quartile, with the line indicating the median value. (Note that mountain group is not shown in the figure.)
Conversely, the ranks among rural groups remain relatively stable. In the absence of urban environments, the effects of latitude and maritime influence were apparent. Thus, coastal and southern rural areas exhibited higher frequency, intensity and duration of compound heat events compared to inland or central areas. Since rural regions undergo rapid nighttime cooling, maritime influence and sufficient solar thermal energy driven by geographical location are important factor in maintaining high temperature. Thereby, among rural groups, southern coastal rural group (SoCR) showed the highest frequencies of both CHE and HW, as well as HW maximum duration, whereas central inland rural group (CeIR) was the group with lowest extreme heat risk.
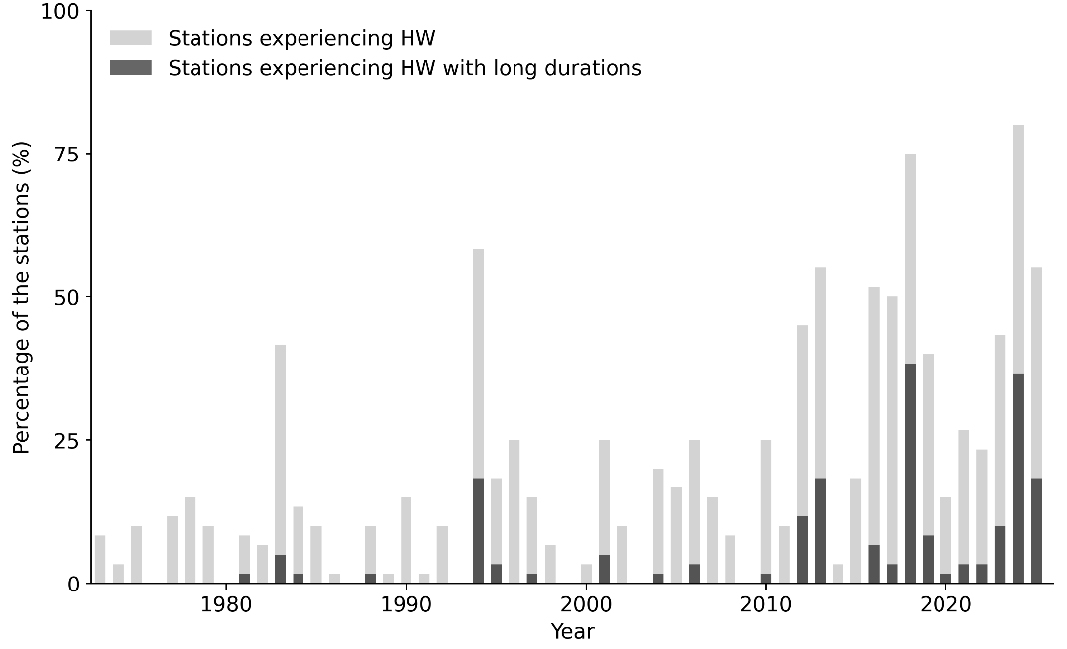
Consistent with the rising HW frequency, their durations exhibited similar increasing trends. Figure 6 presents the percentage of stations experiencing HWs alongside the proportion of stations where HW durations exceeded the 90th percentile threshold calculated for each station. The peaks observed in 1983 and 1994 represent the abnormal conditions as they show notably higher proportion of stations compared to the adjacent years. In contrast, the sustained high frequencies observed since the 2010s are likely to be driven by global warming trend, which is characterized by a steady, and elevated occurrence of HW, including those with durations surpassing the 90th percentile. To sum up, the period following 2010 is marked by an overall increase in HW duration and a higher incidence of extremely prolonged HW.
4. Future Projection of Compound Extreme Heat Events (2021-2100)
The discrepancy in compound extreme heat events between low- (SSP1-2.6) and high-emission (SSP5-8.5) scenarios remained negligible until the 2031-2040 period, however, thereafter this gap began to widen, eventually resulting in entirely distinct distributions (Figure 7). Even under the SSP1-2.6, the compound extreme heat event was projected to increase and strengthen when comparing 2031-2040 and 2041-2050 period. This indicates the residual radiative forcing driven by accumulated greenhouse gas, even under the strongest mitigation pathway (Samset et al., 2020). Nevertheless, their increased levels tend to stabilize, and maintained similar distributions. Under the SSP5-8.5 projection, on the contrary, reconfigurations in distribution are observed, with changes in their overall shapes.
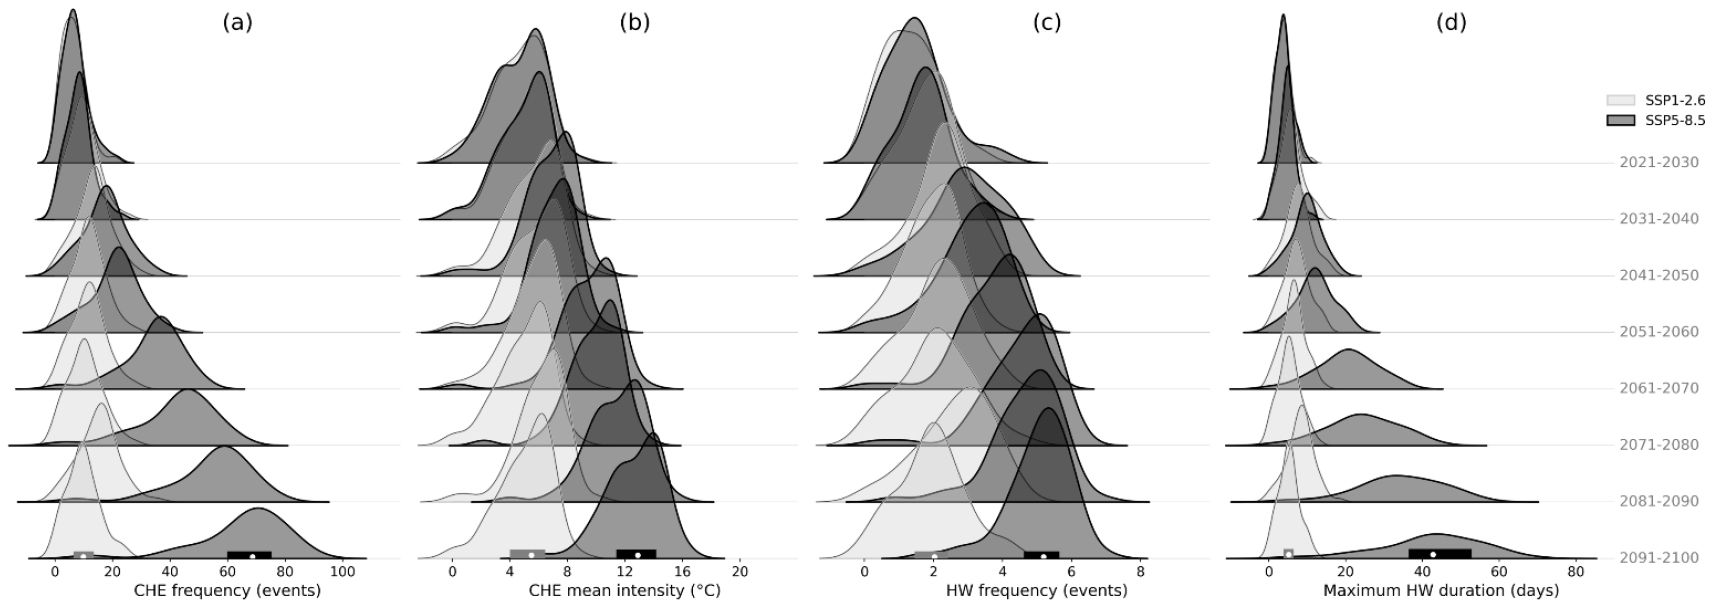
Figure 7.
Future projections of five-member ensemble decadal mean values in (a) CHE frequency, (b) CHE mean intensity, (c) HW frequency and (d) maximum HW duration at 60 stations, 2021-2100. For the final period, bold colored lines indicate the interquartile range (first to third quartiles), while white dots represent the median values of each distribution
During the 2021-2030 period, both low- and high- emission pathways showed narrow and sharp distributions for CHE frequency (Figure 7a). Subsequently, while the SSP1-2.6 scenario maintained its original structure, the distribution under the SSP5-8.5 has significantly flattened with more than doubled base width, indicating a significant broadening of the variance. Thus, in the final period, approximately 75% of the stations are projected to experience extremely high frequency of CHE, exceeding nearly two months of the summer. Furthermore, on the same period, these compound extreme heat conditions are projected to persist continuously for over a month, as 75% of the stations showed maximum duration of nearly 40 days (Figure 7d). The distributions of CHE mean intensity showed relatively minor changes, they nonetheless exhibited relocation toward higher values under the high-emission projection (Figure 7b). Nevertheless, when coupled with the dramatic increase in frequency, their accumulated thermal stress will be more severe.
The distributions of HW frequency across two projections also maintained similar shapes, whereas shift in mean values was observed under the high-emission scenario. This indicates a more concentrated occurrence within a higher range in the far future (Figure 7c). Although the increase in HW frequency was more moderate than that of CHE, it is crucial to consider duration when assessing the impacts of HW, since prolonged HW lead to a reduction in frequency but increase in duration. The distribution of HW maximum duration under the SSP5-8.5 was most pronounced among others, characterized by the broadest base and the lowest peak (Figure 7d). Thus, it is expected that the extreme values appearing in the far future under the high-emission pathway will vary greatly by location. In the distant future, CHEs are projected to occur almost continuously without interruption. Consequently, while the total HW count remains largely unchanged, its maximum duration is projected to increase dramatically, mirroring the pattern of CHE frequency.
Shown in the Figure 8a, the SSP5-8.5 projection exhibited a higher distribution of changing rates for the CHE frequency, accompanied by a greater number of stations showing significant trends compared to the SSP1-2.6. The average coefficient under the SSP1-2.6 scenario was 0.76, while it was 8.50 events decade-1 under the SSP5-8.5. Also notable is that only one station under SSP5-8.5 exhibited a coefficient lower than the maximum coefficient observed under SSP1-2.6 (1.15 events decade-1). On the other hand, the distributions of coefficients for HW frequency were relatively broader than that of CHE frequency, with smaller magnitudes of changes (Figure 8b). The mean coefficients under low- and high-emission projections were 0.13 and 0.54 events decade-1, respectively. Consistent with the analysis of CHE, 59 stations showing significant increases of HW under SSP5-8.5 exhibited higher changing rates than maximum trend of SSP1-2.6. Still, affected by the delayed response of climate to external anthropogenic factors, several of stations exhibited significant increases in compound extreme heat events under the SSP1-2.6 scenario (Samset et al., 2020). This shift highlights the necessity for precise adaptation policies, as potential vulnerability may be higher in these regions due to a lack of historical exposures and inadequate infrastructures to cope with extreme heat (Kim et al, 2021).
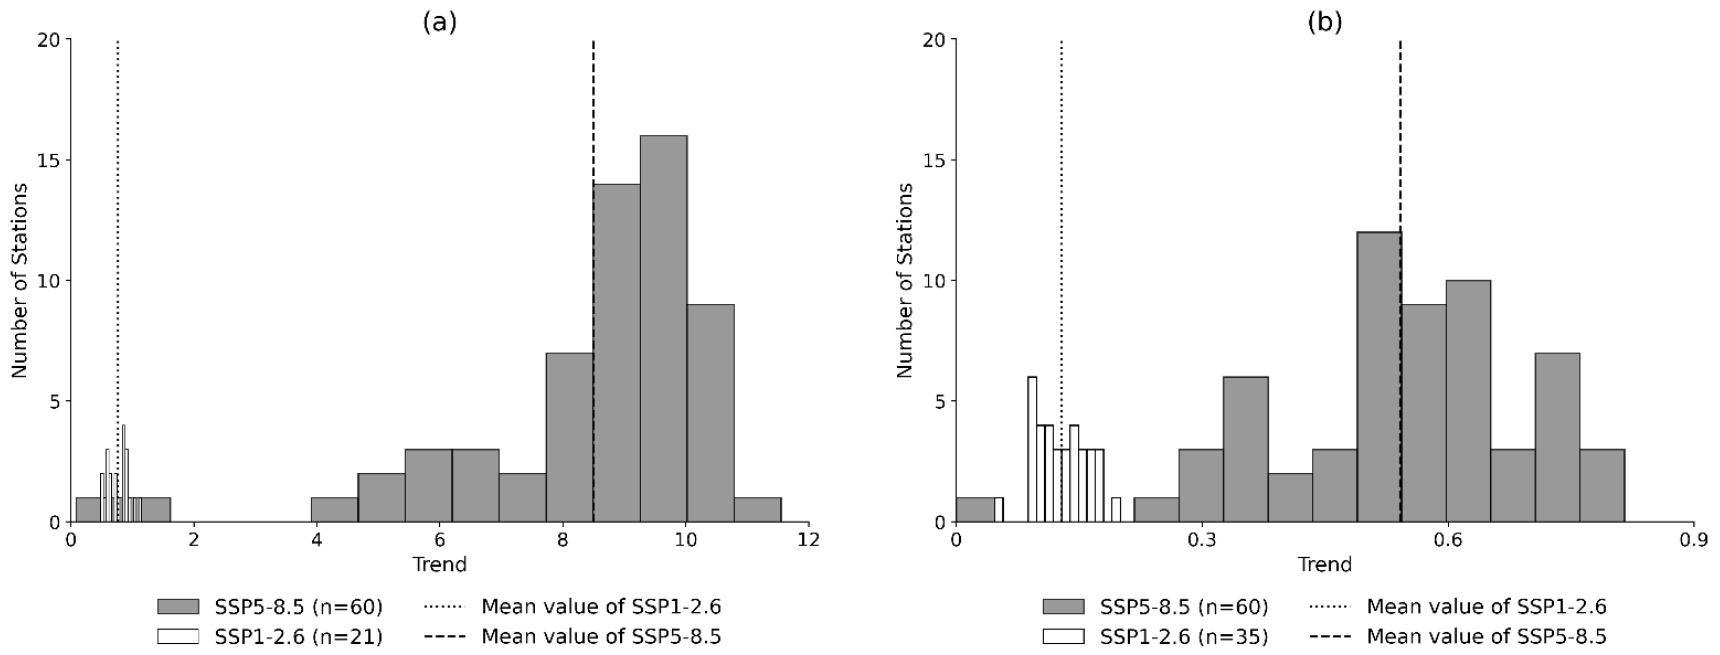
Figure 8.
Comparisons of significant trends for the frequency of (a) CHE and (b) HW between SSP1-2.6 (white) and SSP5-8.5 (gray) scenarios across 60 stations from 2021 to 2100. The histograms illustrate the distribution of significant changing rates (events decade-1), where the vertical lines represent the averaged trend of stations exhibiting significant trends
In terms of CHE mean intensity, maximum HW durations, all 60 stations showed significant increases under the SSP5-8.5, whereas under the SSP1-2.6, CHE mean intensity showed a significant increase at only a single station, with no detectable changes in HW durations. Such trends illustrate reinforced thermal risks under the high-emission scenario while highlighting the substantial mitigation potential of low-emission scenario.
5. Summary and Discussion
The intensified frequency of extreme heat events pose a significant risk to the society by evolving into compound extremes. To evaluate these conditions, we developed two indicators representing prolonged heat events: Consecutive Heat Event (CHE) and Heatwave (HW). CHE is defined as the consecutive occurrence of a Hot Day (HD), a Tropical Night (TR) and another Hot Day (a sequence of HD-TR-HD), while HW is defined as two or more successive occurrences of CHEs. Along with the frequencies of CHE and HW, mean CHE intensity, TX and TN severities of HW and maximum HW durations were also considered to provide a comprehensive assessment of compound heat events.
Based on observational data, the national mean frequencies of HD and TR have shown statistically significant increasing trends, which lead to significant rises in CHE and HW frequencies. The trends were particularly noticeable since 2010, with more frequent compound extreme heat events characterized by higher intensity, severities and longer duration. On the other hand, individual analysis of the 60 stations revealed regional differences, and this geographical heterogeneity was most marked when comparing urban and rural areas. Urban areas exhibited higher frequency, intensity, and duration, which is attributed to the combination of rapid atmospheric heating and the UHI effects that prevents sufficient atmospheric cooling. In rural regions, by contrast, coastal and southern areas showed more pronounced compound heat events. Furthermore, HW durations were closely coupled with the overall upward trends in CHE and HW frequencies, with noticeably longer duration since the 2010s.
Projections under the SSP5-8.5 scenario indicated that compound heat extremes will become increasingly frequent and intense, with growing thermal risks underpinned by larger increases in frequency, intensity and duration across all 60 stations. Even under the SSP1-2.6 scenario, some stations exhibited significant increases in frequency, however no changes were detected in intensity and duration. The disparity between both scenarios widened as time progressed, reflecting the irreversibility of anthropogenic climate forcing.
Compound heat events have increased significantly in the Republic of Korea, consistent with the findings of Wang et al. (2020) and Wu et al. (2023). These trends are likely driven by anthropogenic climate change, as suggested by Wang et al. (2020). Thus, adaptation policy aimed at alleviating these impacts are essential. In particular, under the high-emission pathway, compound heat extremes are projected to transcend current historical records, and further, the records will be continually supersede by even more severe conditions. Such steep escalation of extreme heat events will lead to disastrous impacts, underscoring the imperative for robust climate resilience strategies. Not only under the high-emission scenario, but also under the lowest emission scenario, significant increase in compound heat events was detected. Thereby a comprehensive understanding of compound heat extreme along with a precise adaptation policies even under SSP1-2.6 are essential.
While this study provides a comprehensive overview of historical trends and future projection for compound events in the Republic of Korea, it does not fully elucidate the physical mechanisms. Thus, further research focusing on the complex relationships between climatic drivers and compound heat events is needed to identify the specific conditions that lead to climatic extremes. Also, diverse climatic drivers should cover not only location, urbanization level, and latitude, but also topography, SST, or soil moisture which are known as the important drivers for extreme heat events (Miralles et al., 2014; Park et al., 2016; Lee et al., 2024). Furthermore, using data from 60 weather stations limits the ability to analyze meteorological conditions at a consistent spatial scale, disabling the regional characteristic evaluations in a uniform distribution. Thereby, the incorporation of high-resolution data would facilitate analysis under equivalent conditions and express geographical heterogeneity more precisely.
