

1. Introduction
2. Study Area
3. Materials and Methods
1) Backgrounds
2) Spatial Analysis using PySAL
4. Results
1) Model 1
2) Model 2
5. Discussion
6. Conclusion
1. Introduction
Zircon minerals form when magma crystallize from igneous rock. Because these crystals contain radioactive elements of uranium and thorium in their structure, they can be radiometrically dated and provide the crystallization age. Because these crystals are hard and durable to both physical and chemical weathering, they persist in sedimentary deposits, where they are termed detrital zircons (DZ). Thus, DZs offer useful information on the provenance of sediments, if enough information exists to the interpretation of age source rocks that eroded to supply the sediment. In the USA, Kimbrough et al.(2015) used DZs to determine of provenance of sediment in the Colorado River system. Abundant research regarding DZ provenance, however, reveals that the interpretation of the relationship between DZ age spectra and their source area is mainly based on qualitative knowledge of probable source areas (Andersen, 2005; Krapež and Pickard, 2010). For example, geological maps where zircon ages are measured for in situ bedrock are used to qualitatively interpret the histogram peaks of DZ ages for sediments.
In this study, a new quantitative method to estimate DZ provenance is presented using spatial analysis performed with an open source library Python Spatial Analysis Library (PySAL) (Rey and Anselin, 2007; 2010), Specifically, “computational geometry module” and “spatial weights module” within PySAL were selected that operate to determine nearest neighbor efficiently in large datasets, and to construct spatial weights from various input formats such as ESRI shape file and GeoJSON. As an open source, no expensive license software is required, and it provides public access to scientific source code that easy to replicate and reproduce (Rey, 2019). Given the advantages of open source and the power of the python language, this approach estimates using PySAL whether the areal distribution of geology units reflect the age spectra of DZ. This is the first study, to my knowledge, using these spatial analytical techniques to interpret DZ data. To test this approach method, a study area with a distinctive geomorphic history was selected- where sediments analyzed for DZ experienced a drastic change of source-region rocks due to the integration of new river systems.
2. Study Area
Relatively little is known about the landscape history of the Sonoran Desert (e.g. Spencer and Reynolds, 1989; Seong et al., 2016a, 2016b; Jeong et al., 2018; Jeong, 2019, 2020; Jeong and Dorn, 2019; Douglass et al., 2020; Oh et al., 2020; Skotnicki et al., 2020). In an effort to better understand water resources, with the added benefit of understanding landscape evolution, an energy and water organization called the Salt River Project (SRP) has drilled hundreds of wells in the region. Research involving a few dozen wells in the East Salt River Valley (Figure 1) found evidence for the sudden arrival of Salt River in the East Salt River Valley, interpreted by a sharp contact between ancestral Salt River deposits and underlying basin-fill deposits exist, showing significantly different mineralogy (Figure 2). The proposed hypothesis to explain the difference of the two units is that basin-fill sediment derived from local sources all within the closed basin (Figure 3A). Such closed basins are common in extensional plate tectonic contexts like the Basin and Range Province, and thus original drainage basin size was small and local (Figure 3C). Then, Salt and Verde Rivers arrived through the process of lake overflow and began depositing the ancestral Salt River deposit (Figure 3B), and drainage basin enlarged due to the river integration, starting to resemble current drainage basin (Larson et al., 2016; 2017) (Figure 3C).
To solve questions regarding the evolution of the Salt and Verde River basins (Figure 1) and why the rivers suddenly arrived in the East Salt River Valley sometime in past, SRP-supported researchers collected and analyzed DZ samples from the Brown and Mesa Well that contains two distinct gravel types: (1) basin-fill deposits between 320-330 feet (98-101 m) below surface (DZ SRP1), and (2) ancestral Salt River deposit between 160-170 feet (49-52 m) below surface (DZ SRP2) (Figure 2). All 150 U-Pb zircon ages are plotted on the graphs (Figure 4) and showed substantial different age distributions of DZ ages between the two samples: (1) the basin-fill deposits (DZ SRP1) contain multiple smaller peaks at near 9 Ma and 11 Ma, but the ancestral Salt River deposit (DZ SRP2) contain one strong peak at near 8 Ma; (2) DZ SRP1 contain a large peak centered between 18-19 Ma, but DZ SRP2 contain a smaller peak centered near 21 Ma; (3) DZ SRP1 contain zircon ages between 30 and 850 Ma, but DZ SRP2 does not; (4) DZ SRP2 contain a large peak near 1200 Ma, but DZ SRP1 does not; (5) both deposits show peaks near 1450 Ma, though DZ SRP1 is much smaller; and (6) both deposits show peaks near 1650 Ma, though DZ SRP2 is much smaller.
The considerably different age distributions of DZ age spectra could be the result of drainage evolution in this area. In other words, the sources of DZ SRP1 were rocks within the paleo-drainage basin (Figure 3A and C), while rocks within much larger current drainage basin likely provided DZ SRP2 (Figure 3B and C). To examine whether the aerial distribution of rocks actually affect to the age spectra of DZ ages, first this study analyzed the areal distribution of geological units before and after river arrivals, and produced the age distributions from a new 2-D spatial model. Then, the modeling age distribution was compared to the empirical age distributions of DZs. Specifically, this study asks the following questions: (1) does the areal distribution of geological units before river arrivals reflect DZ SRP1? and (2) does the areal distribution of geological units of the current drainage reflect DZ SRP2?
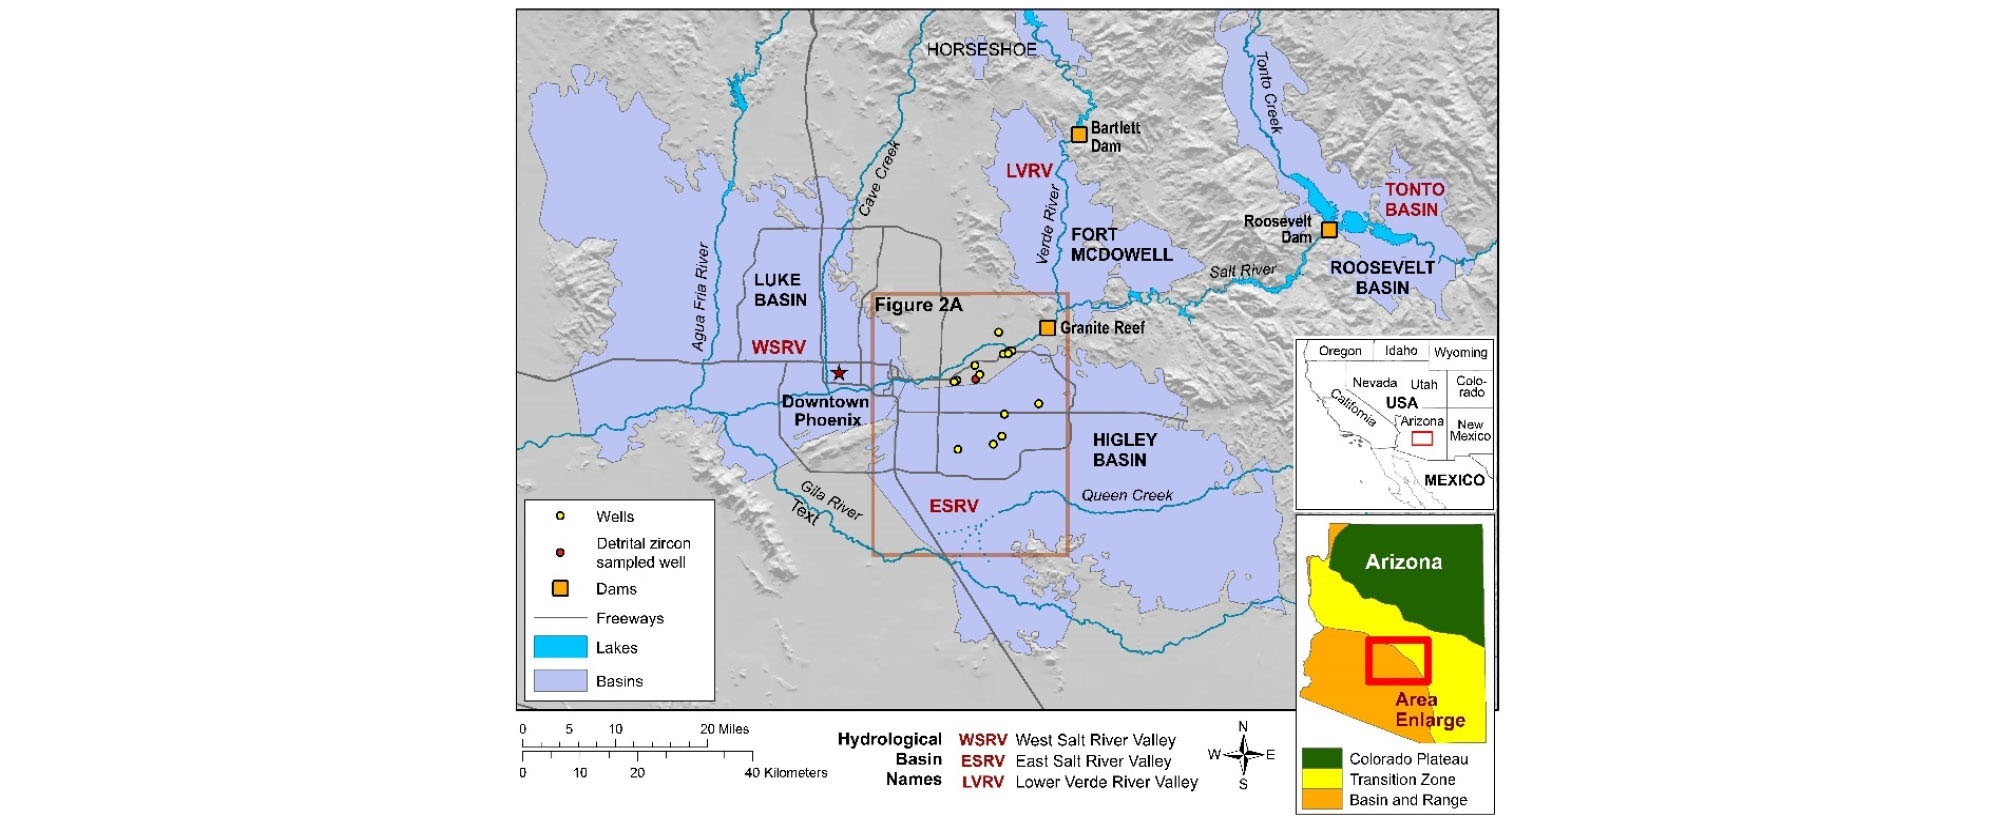
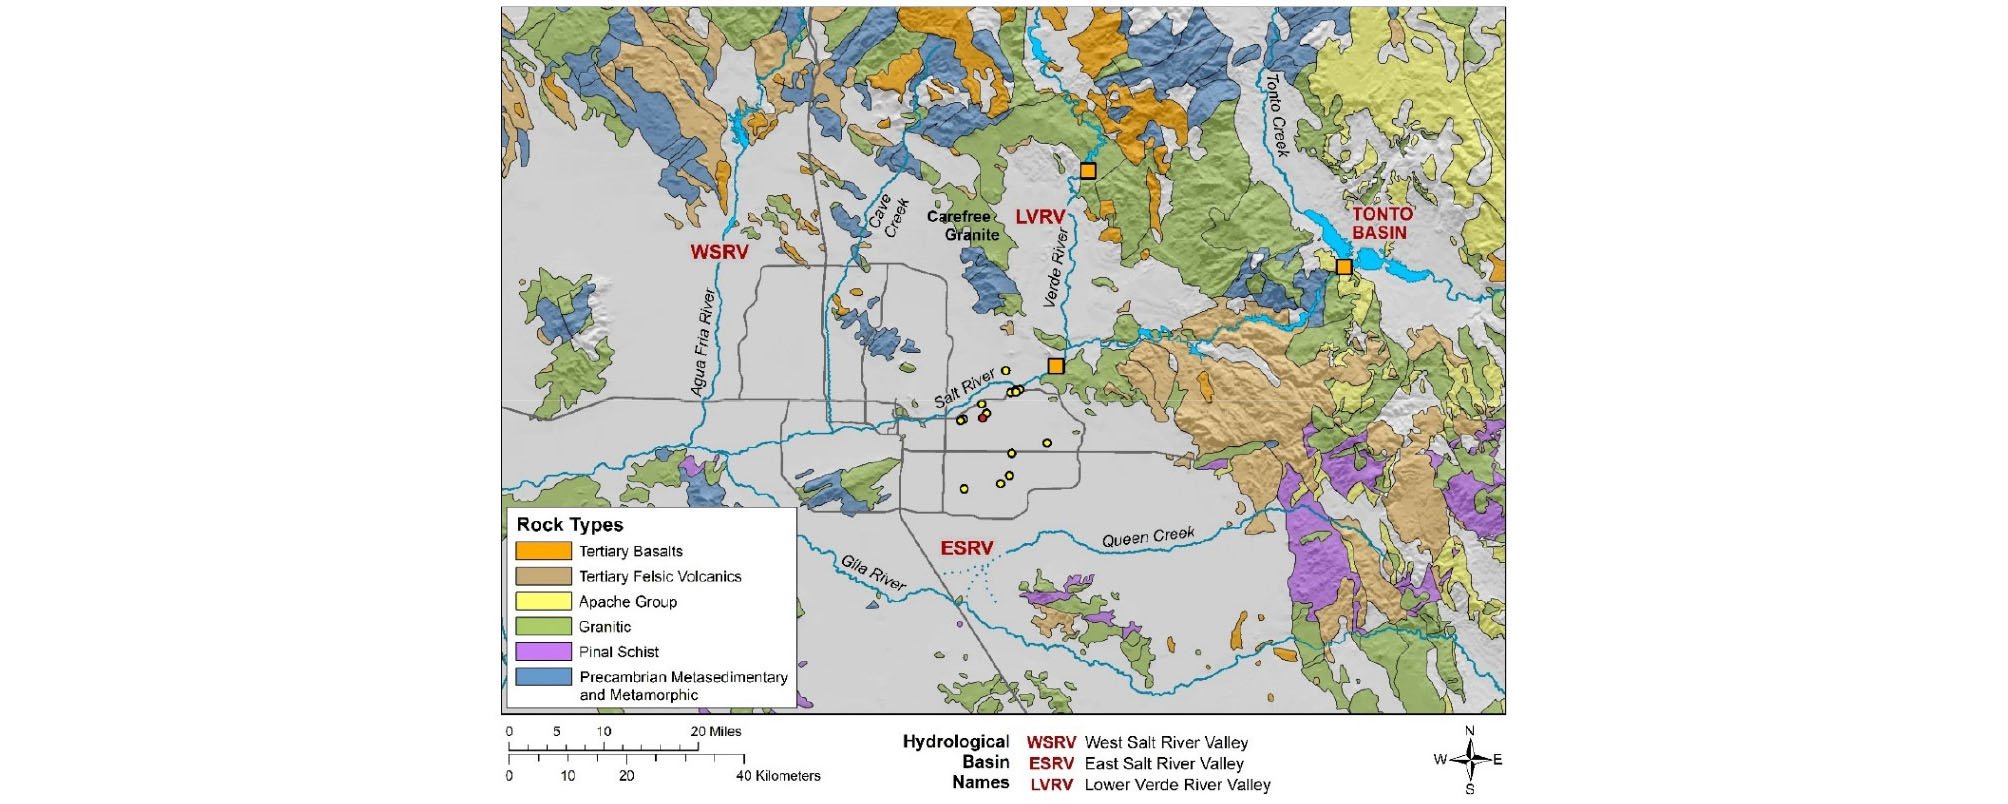
Figure 1.
Map of the Salt and Verde river basins with drilled well locations. The exoreic Salt and Verde rivers integrated across the lowlands of the extensional tectonic terrain of the Basin and Range Province (Larson et al., 2017; Dorn et al., 2020; Skotnicki and DePonty, 2020; Skotnicki et al., 2020). The map is courtesy of Barbara Trapido-Lurie, School of Geographical Sciences & Urban Planning at Arizona State University
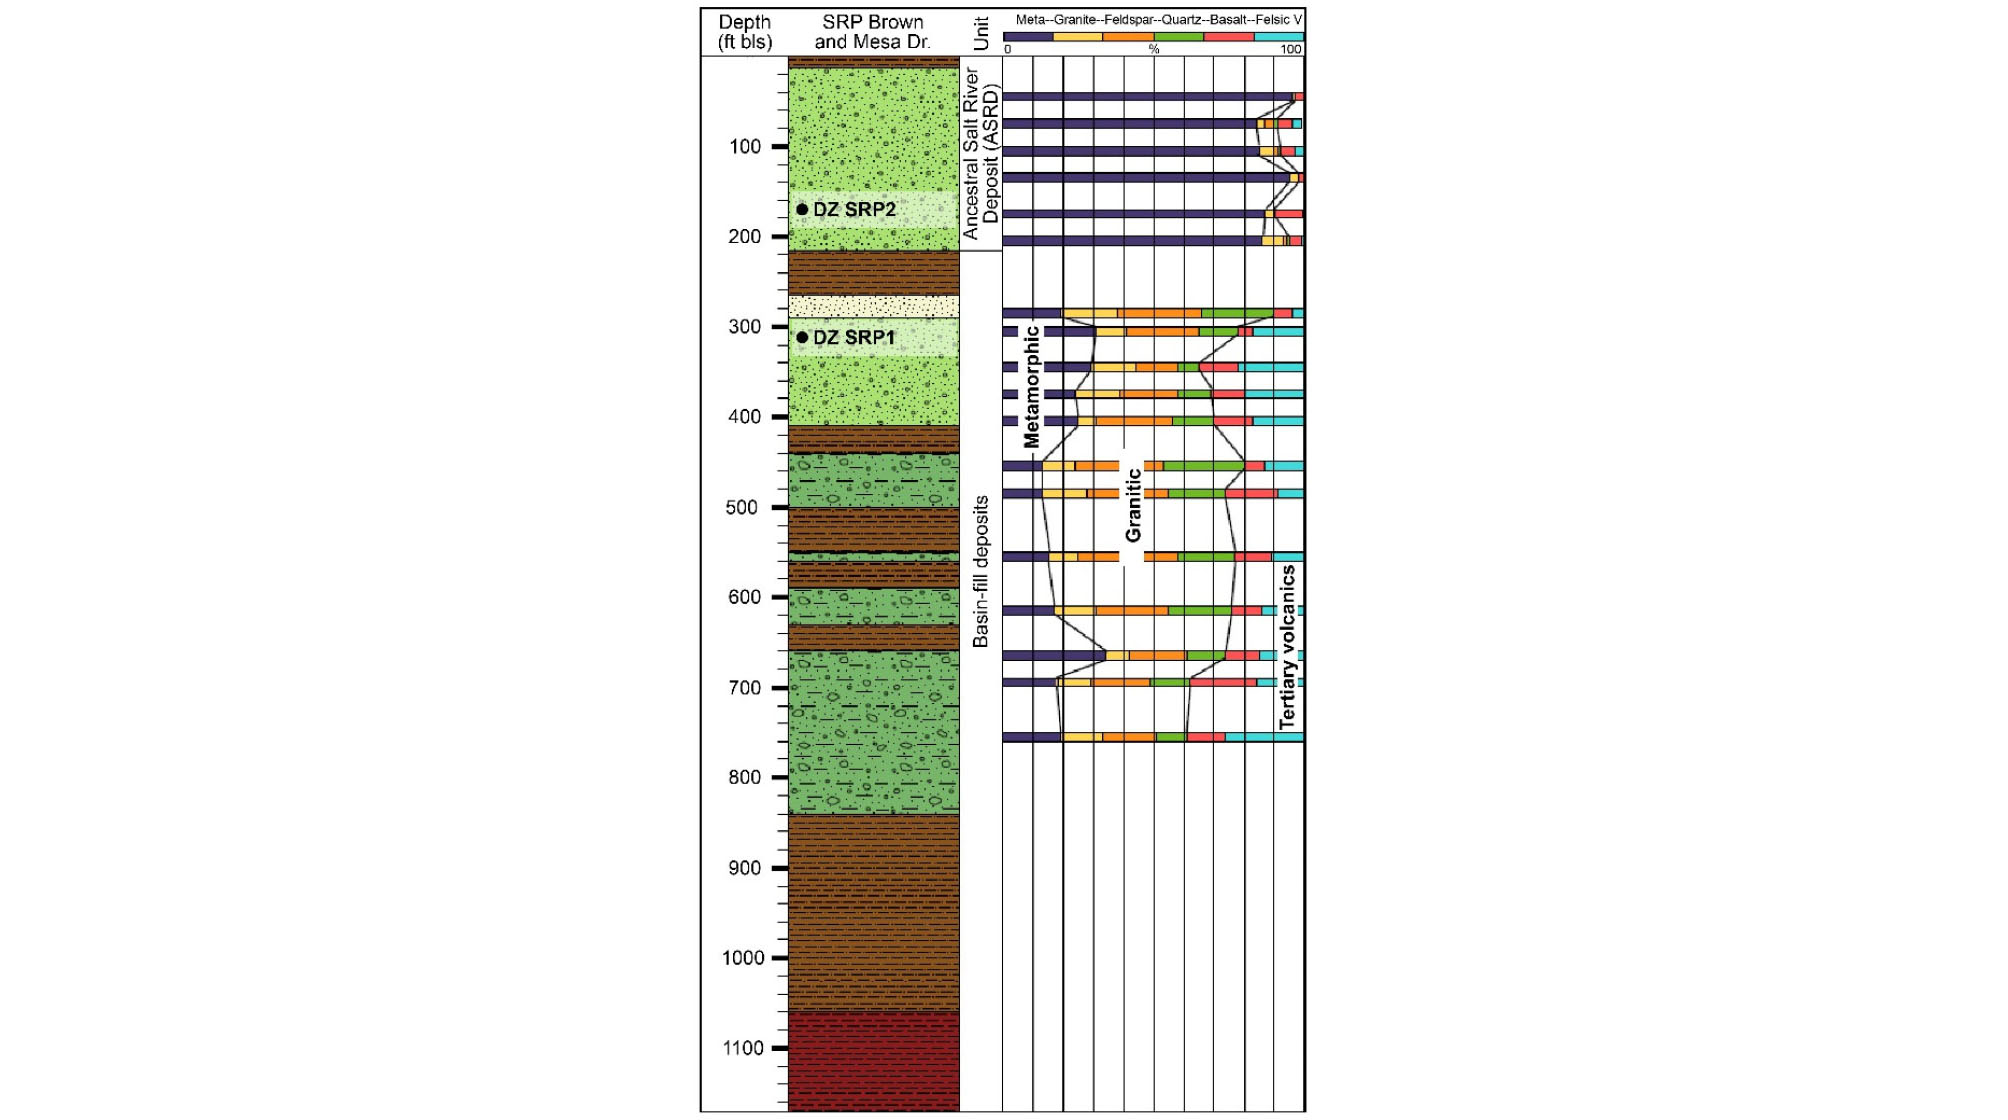
Figure 2.
Sedimentary log of SRP well and sampling depth of detrital zircon sample, Skotnicki and DePonty (2020). Note that the significant difference of mineralogy between basin-fill deposits and ancestral Salt River deposit
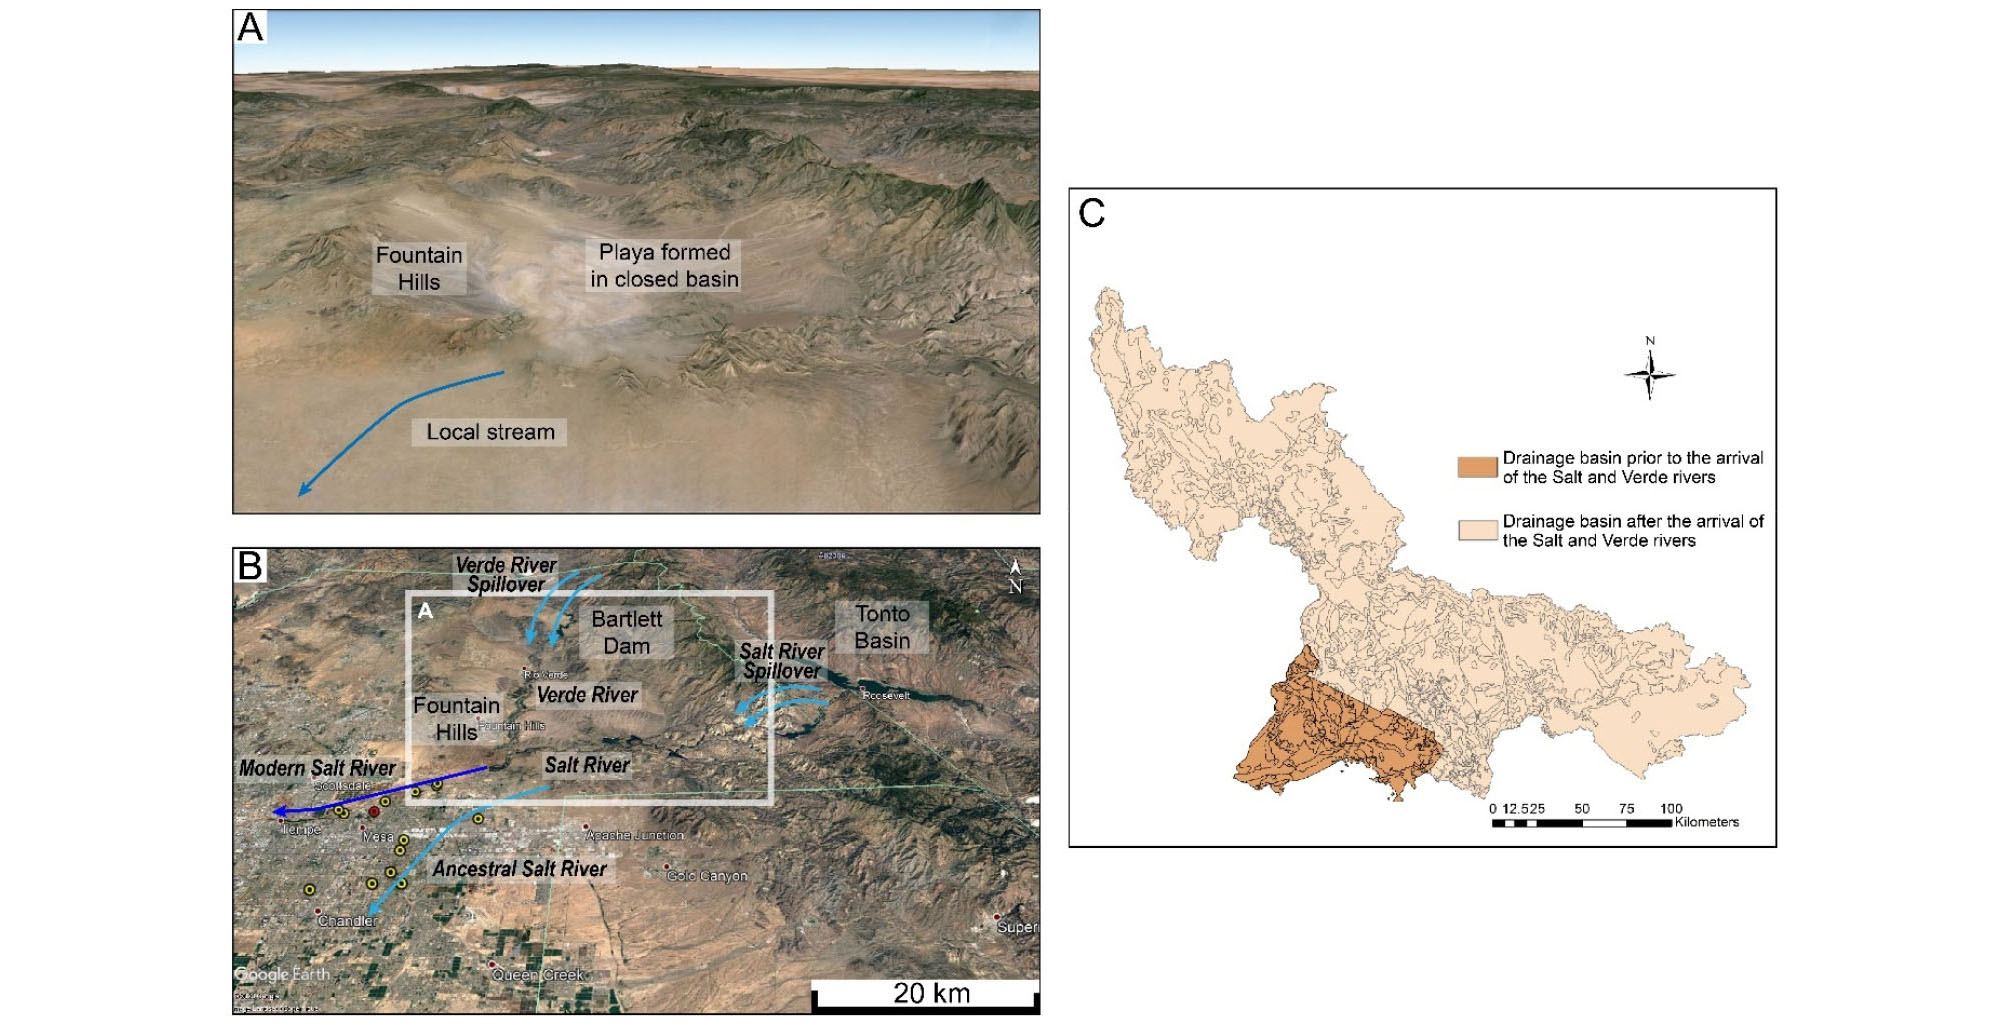
Figure 3.
(A) Artistic rendering of the Lower Verde River Valley’s closed basin prior to the arrival of the Salt and Verde Rivers, courtesy of Ariel Shamas. (B) Current Salt and Verde River drainage basins as seen in Google Earth. (C) Drainage basin prior to the arrival of the Salt and Verde Rivers compared with the current drainage basin used for this study. The boundaries are based on the author’s geomorphic interpretation in discussions with the SRP research team
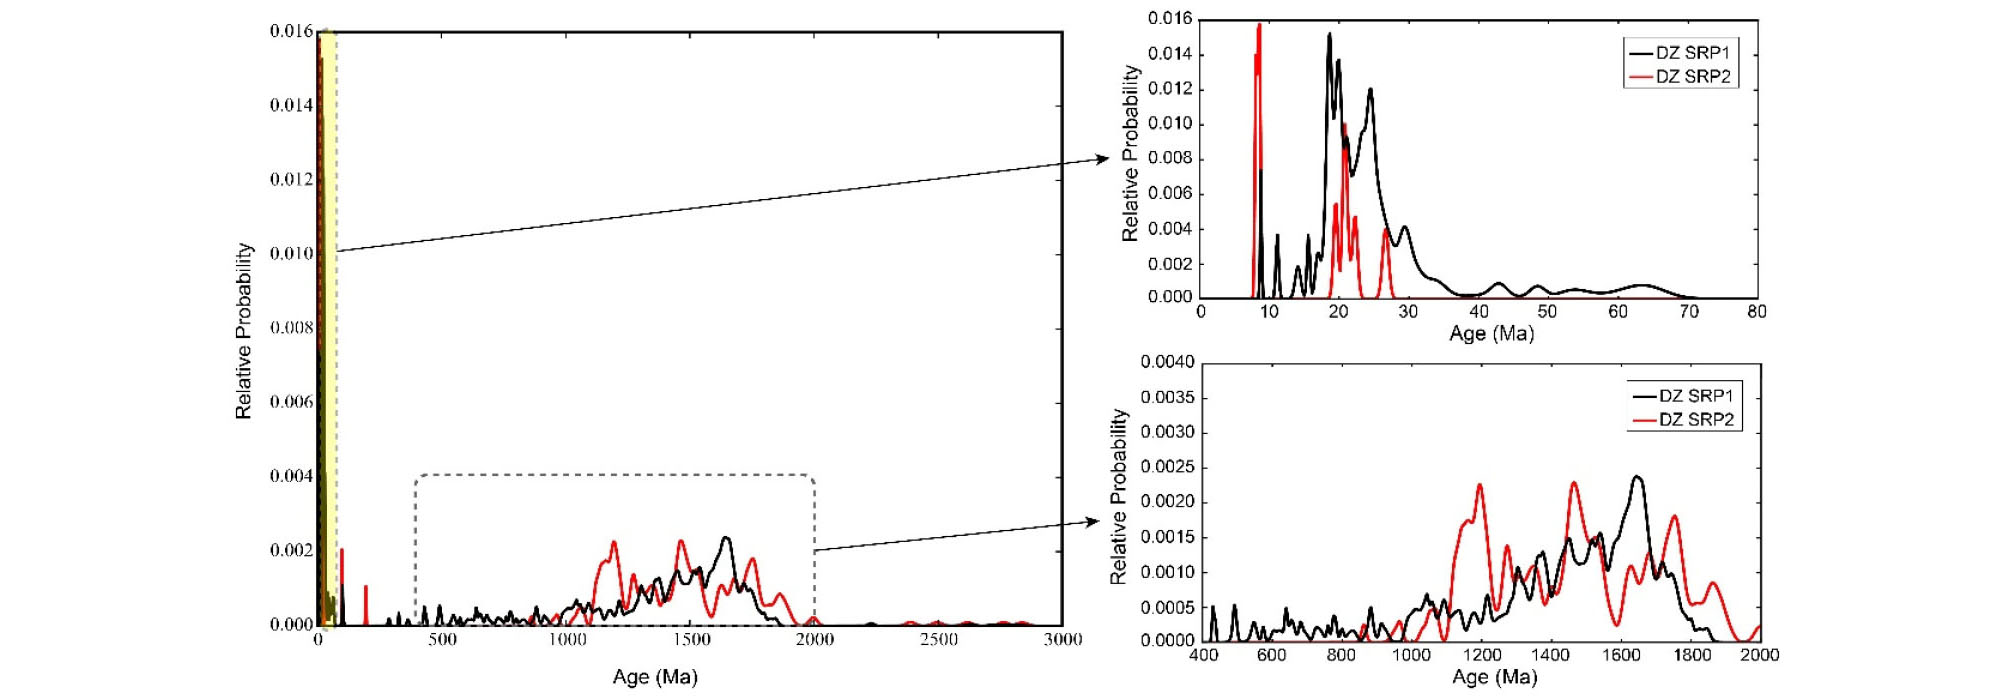
Figure 4.
Probability density plot showing the age distribution of detrital zircon ages for ancestral Salt River deposit (in red) and the underlying basin-fill deposits (in black), courtesy of Dorn et al.(2020)
3. Materials and Methods
1) Backgrounds
The purpose of this study is to examine the effects of areal distribution of lithology on DZ ages, so that 2-D spatial model was developed in this study. In reality, there are certainly other factors controlling catchment erosion rates and thus, potentially affect to the DZ age spectra. For example, Jeong and Dorn (2019) reported watersheds underlain by granite showed statistically significant higher erosion rates compared with watersheds underlain by other rock types in the Sonoran Desert possibly due to rock decay characteristics. Rock strength is also an important factor that could affect to the channel morphology (Lee, 2007) and denudation rate (Palumbo et al., 2010). However, evaluating the decay characteristics and strength of rocks lies beyond the scope of this paper. 3-D Modelling considering those factors is left for future work.
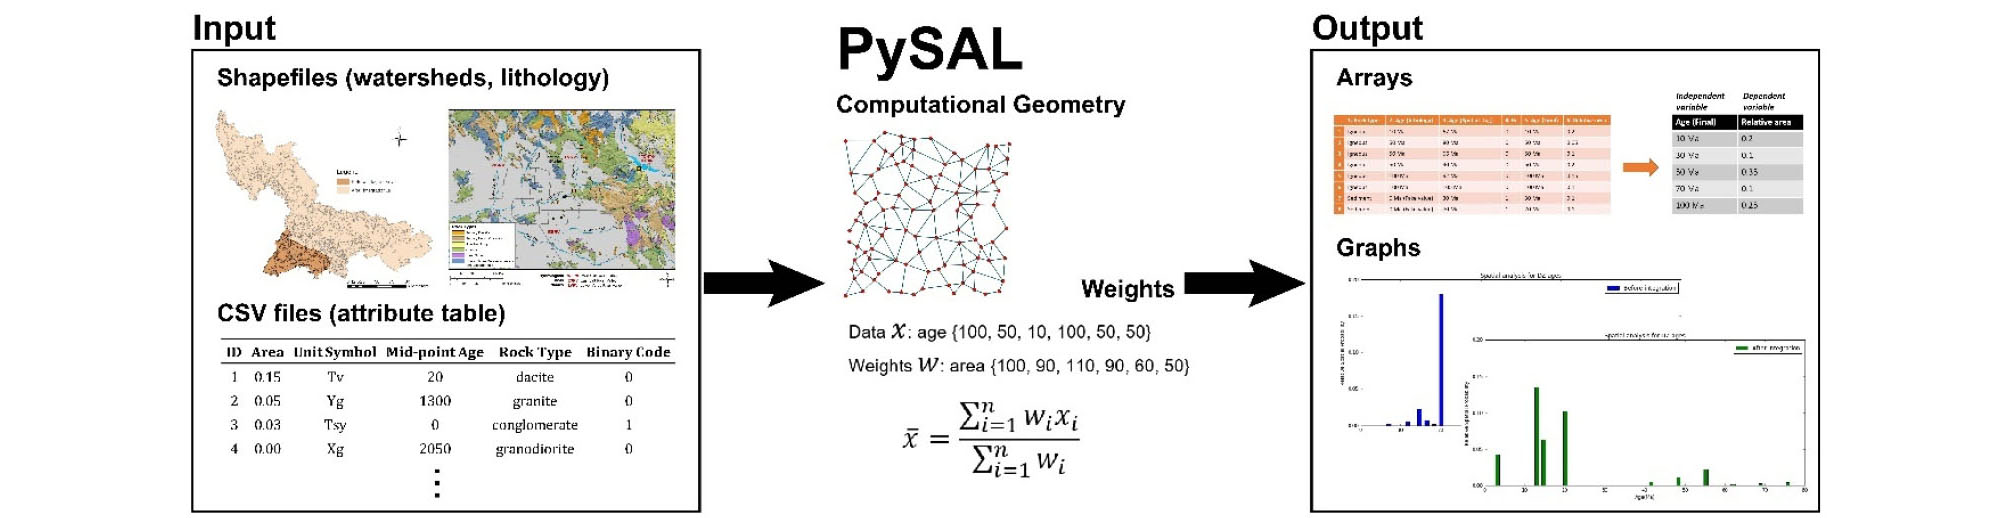
The key to solving the research questions, of whether the areal distribution of geological units reflect to age distribution of DZ age spectra, involves spatial analyses of the areal distribution of geological units within watersheds. PySAL, an open source library written in the object oriented language Python, includes components such as map calculations, computational geometry, spatial weights that process large data efficiently (Rey and Anselin, 2010). Hence, The data analytic functions of PySAL was used to calculate the relative probability of DZ ages based on the areal distribution of lithologies (Figure 5).
Input lithological data came from the Arizona Geological Survey (Figure 6, http://www.azgs.az.gov/services_azgeomap.shtml) and Skotnicki (2002). Watershed GIS data derived from the Arizona Department of Water Resources (http://gisdata-azwater.opendata.arcgis.com/datasets), where the current Salt River watershed shapefile was used for the modern condition. Since no shapefile existed for the pre-drainage integration landscape, a new shapefile for the past drainage area was created, removing everything upstream of Bartlett Dam on the Verde River and everything upstream of Roosevelt Dam on the Salt River. These areas and geology source areas were simply removed from the current Salt River watershed shapefile based on the geomorphic evidences that show likely boundaries of the past drainage basin (Figure 3C). Areal distribution of geology units within the past and modern drainage basins were then analyzed with ArcGIS clip tool.
(1) Model 1: exclusion of sedimentary rock units
To calculate the relative probability of rock ages based on the areal distribution of rock unit, igneous and metamorphic rock units were selected at first (Table 1) because of the characteristic of zircon crystals. Zircon crystals form when crystallization from magma or lava or in metamorphic rocks, resulting in simple age populations, but it is rare case for other rock types such as sedimentary rocks (Nelson, 2001). Therefore, for the first analysis, midpoint age of igneous and metamorphic rock units was used (Table 1), and the proportion of rock ages were calculated as the area of each rock unit divided by the total area of the watershed.
Table 1.
Igneous and metamorphic rock units in the study area. Midpoint age was used for analysis. The mapping units, unit ages, and rock types are derived from the geological mapping work of the Arizona Geological Survey (e.g. Skotnicki and Ferguson, 1995; 1996; 1997)
(2) Model 2: inclusion of all rock units
Sedimentary rocks often show complex DZ age patterns (Nelson, 2001), because a sedimentary deposit could experience multiple episodes of magmatism, or tectonic juxtaposition, or mixing by streams transported from multiple igneous rock sources (Thomas, 2011). Given the complexities, the ages of sedimentary rock units in geology map cannot be used to determine the DZ age of sedimentary rock. However, increased availability of DZ data enables to estimate possible source terranes of a certain sandstone based on the proximity to the source terranes and compared the age distributions of the source terranes against the DZ age distributions of the sandstone (Gehrels, 2014). With this approach, therefore, a crude way to estimate the DZ age of sedimentary rock unit may become possible. In this case, zircon crystals, typically very small sand-size grains, in a sediment deposit are more likely to be delivered from neighboring igneous rock source areas due to the shorter transport distance (Figure 7) with the basic assumption that sedimentary deposits contain components from multiple crystalline sources only by river transportation and nothing else. Another factor that could affect to the flux of zircon crystals to the sediments is the area of the neighboring source areas. In other words, the flux of DZ crystals from a particular part of the watershed could be proportional to area of igneous rock units neighboring the sedimentary rock unit. Therefore, area-weighted average ages were calculated to determine the ages of sedimentary rock units (Figure 7).
2) Spatial Analysis using PySAL
As describe in the preceding section, while lithologic ages can be used for igneous rock units to calculate DZ age spectra, sedimentary units require alternative ages based on spatial weights (Figure 7). “Rook weights” and “k-nearest neighbor (knn) defined weights” within PySAL were used. First, rook weights are a type of contiguity weight (e.g. Yim and Song, 2020), but determine neighbors only when they are sharing an edge. Thus, if a specific polygon of rock unit within watershed shapefile does not share an edge with other polygons (i.e. “island”), the rook weights do not consider the observation as neighboring. While knn defined weights are a type of distance weight, so they define neighborhoods based on the specific radius. Thus, the rook weights with knn defined weights were combined that consider observations as neighboring when the polygon is within a certain distance, to avoid the issue of island polygons. It was assigned k = 3 km for the watershed shapefile before river arrivals, and k = 300 km for the watershed shapefile after river arrivals due to much larger drainage area. After analyzing neighboring polygons, the proportion of area of the neighboring polygons was calculated. Then, area-weighted average ages that based on data as age and weights as area were calculated for all the polygons of rock units within watershed (Figure 7 and AgeS in Table 2). Since this spatial analysis should be applied only for the polygons of sedimentary rock units, binary code was assigned (sedimentary rock units = 1, igneous or metamorphic rock units = 0 in Table 2). Using the binary codes, the ages of all the polygons of rock units within the watersheds (AgeF) were calculated as: AgeS (based on spatial weights)*Binary code (0 or 1) + AgeG (from geology map) (Table 2), then the relationship between the ages (AgeF) and area as a result of spatial analyses plotted as relative frequency histograms.
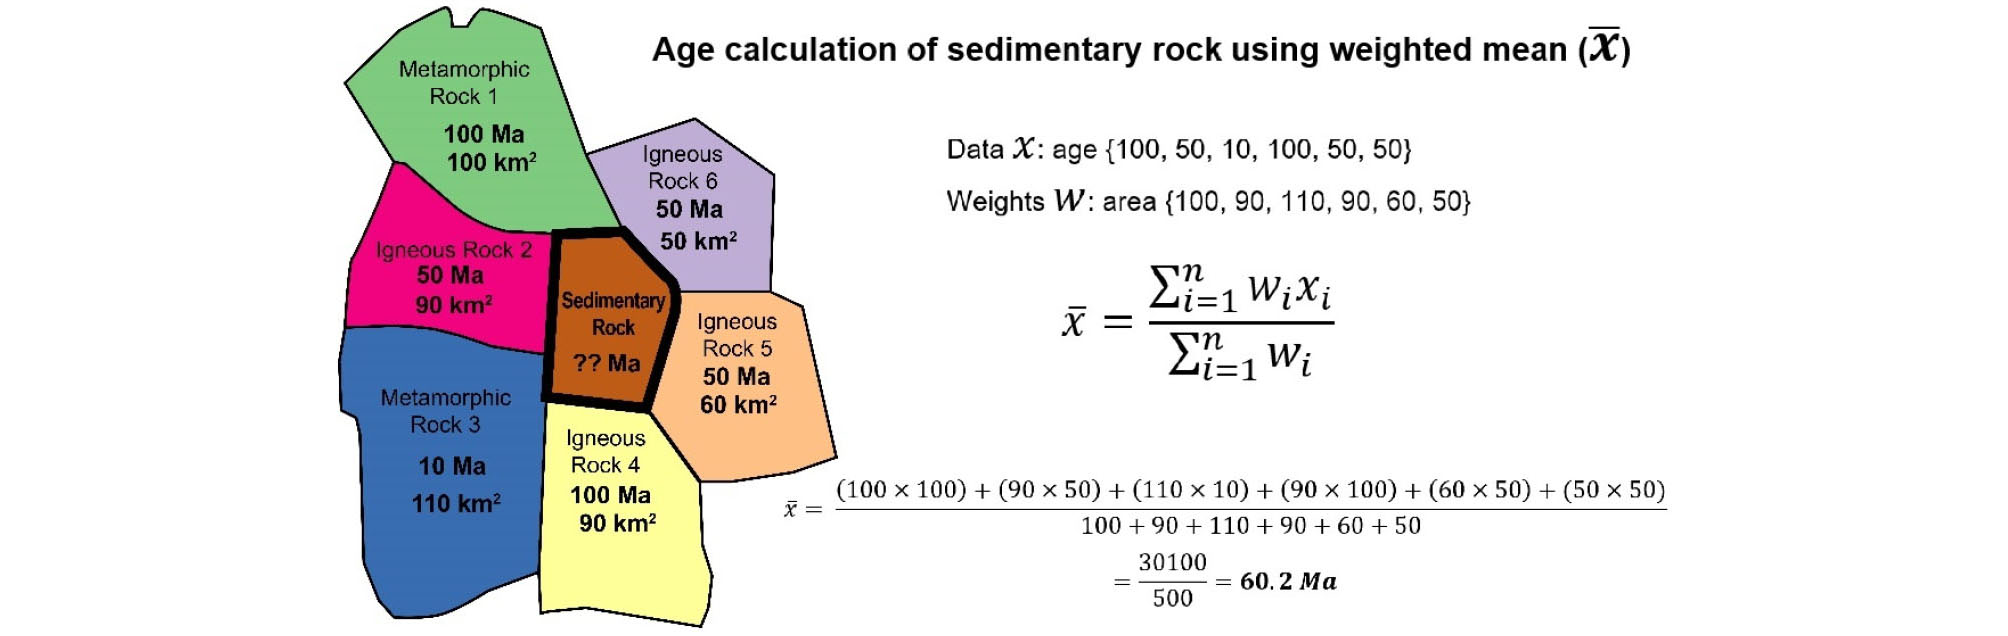
Table 2.
Processes of determination of ages and creation of a relative frequency table
4. Results
1) Model 1
The results of model 1 for the closed-basin condition prior to drainage integration are represented as relative frequency histograms (Figure 8A and B), as are the modern configuration of the drainage basins (Figure 8C and D). Partial matches are identified between the relative frequency histograms as a result of spatial analyses and the probability density plots of the age distribution of DZ age.
The histogram of spatial analytic ages before river arrivals contains a smaller peak at about 14 Ma and a larger peak at about 20 Ma, as does the DZ age probability density plot of basin-fill deposits (DZ SRP1) (Figure 8A). No large peaks in the histogram of pre-river arrivals are observed between 30 Ma and 1900 Ma (Figure 8A and B), and this is not consistent with the age distributions from DZ ages plot (DZ SRP1). The histogram of post-river arrivals contains a smaller peak at about 3 Ma, and large peaks at about 13-15 Ma and 20 Ma (Figure 8C). The 20 Ma age peak is consistent with the large peak at 20 Ma in the DZ plot (DZ SRP2), but the strong peak about 8 Ma in DZ SRP2 does not show in the histogram (Figure 8C). In the older age range (Figure 8D), no large peaks in histogram of post-river arrivals are observed.
2) Model 2
The results of model 2 for pre-river arrivals are represented as relative frequency histograms (Figure 8E and F) as are post-river arrivals (Figure 8G and H). Overall, the ages of model 2 are more dispersed than the results of model 1. The histogram of spatial analytic ages before river arrivals contains smaller peaks at about <20 Ma and a larger peak at about 20 Ma, that is well-matched with the age distributions of the probability density plot of DZ SRP1 (Figure 8E). Unlike model 1, model 2 including all rock units in the spatial analysis contain a variety of peaks between 400 and 1900 Ma though the relative probability of these peaks is very small (<0.002) (Figure 8F); this peak size issue is likely a product of spatial analysis using weighted mean for sedimentary rock units. Similar to model 1, the histogram of model 2 contains a smaller peak at about 3 Ma, and large peaks at about 13-15 Ma and 20 Ma (Figure 8G). Model 2 contains a few small peaks between 40 and 80 Ma (Figure 8G), but DZ SRP2 plot does not. Model 2 also contains a number of small peaks between 400 and 1050 Ma (Figure 8H), but they are smaller than peaks in the same age range in the histogram of pre-river arrivals (Figure 8F and H).
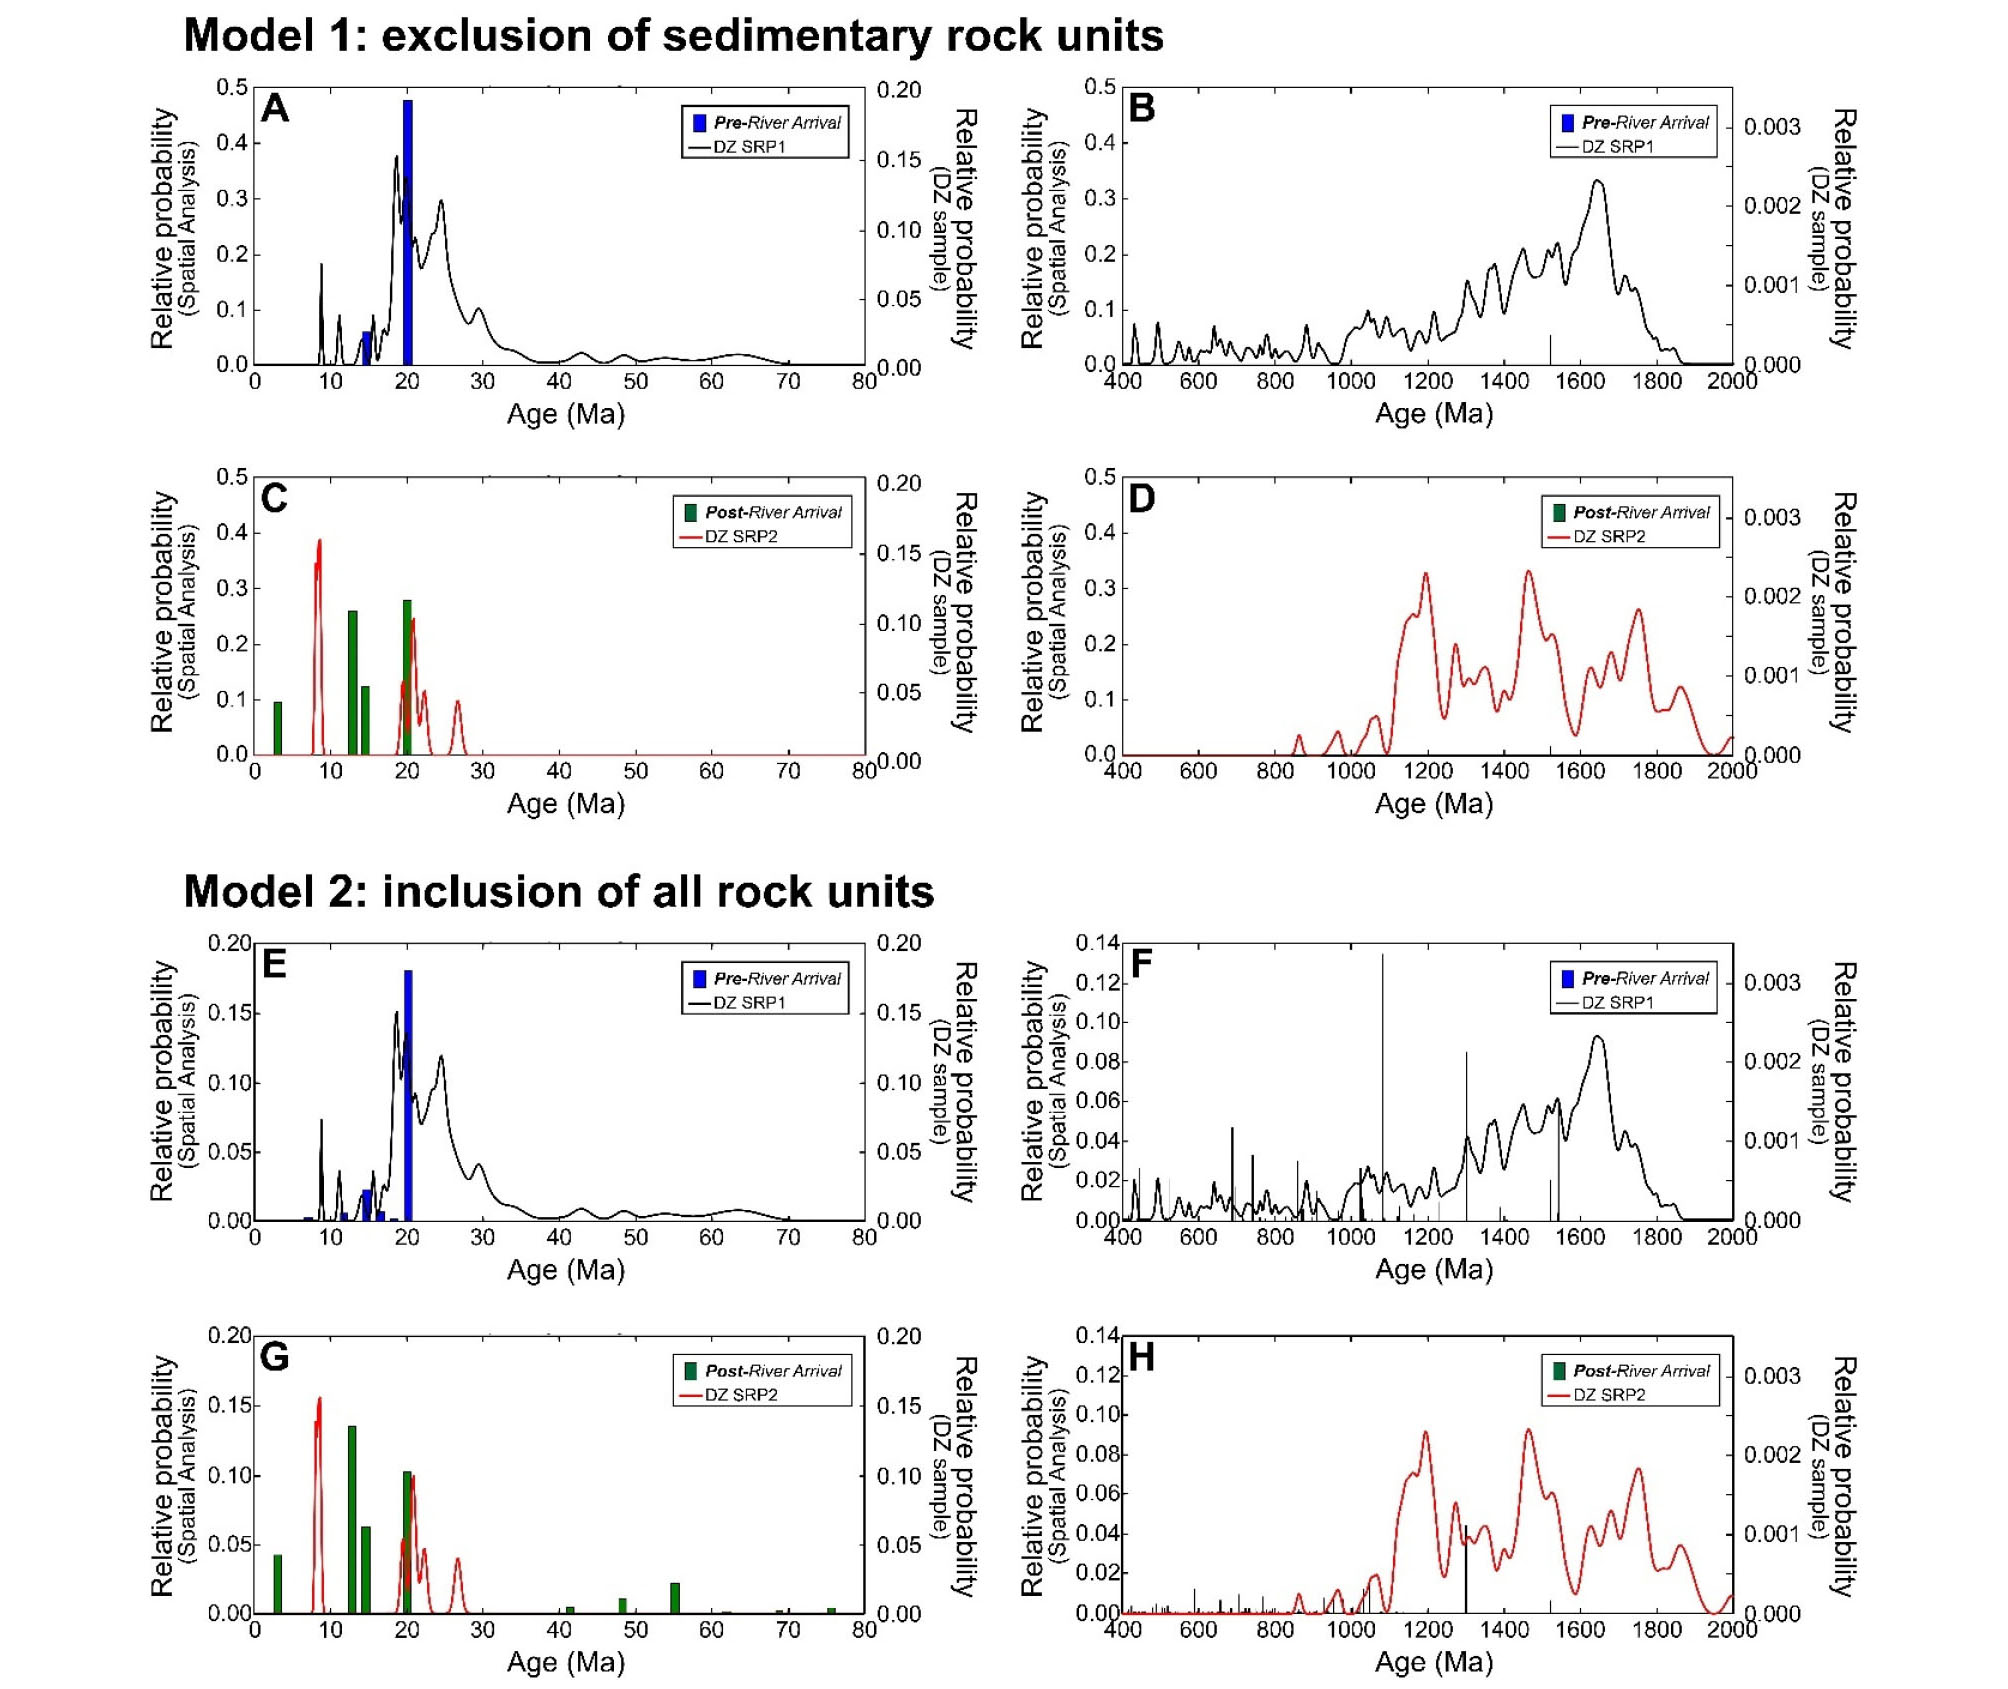
Figure 8.
Relative frequency histograms of ages as a result of spatial analysis. Probability density plots of the age distribution of detrital zircon ages are also represented for the purpose of comparison. (A-D) Results of model 1 that excluded sedimentary rock units. (E-F) Results of model 2 that included all rock units. (A, B, E, F) Results of spatial analyses using a watershed representing pre-river arrival. (C, D, G, H) Results of spatial analyses using a watershed representing post-river arrival. Note that the scale of vertical axes are different
5. Discussion
There has been increasing efforts to match DZ age components with those of potential sediment sources in some scholarships in the literature, which are based on the integration of stratigraphic, sedimentologic, tectonic, and paleogeographic framework (Thomas, 2011) with abundant DZ data from lithologies in potential source area (e.g. Gehrels et al., 2011). This study provides a rapid and easy way to assess the relationship between DZ age components and their potential source areas with already existing data on ages of lithological units from geologic map, instead measuring DZ ages from all probable source rock units in upstream drainage area, which is the great advantage over other studies.
The research questions of this study focused on whether it was possible to quantify the assessment of DZ provenance, and whether the areal distribution of geological units reflects to the age distributions of DZs. Spatial analyses using PySAL enabled the quantification of areal distribution of geological units and calculated area-weighted ages for all types of rock units, including sedimentary rocks. The histograms modeled through spatial analyses showed clear differences between the age distributions of pre- and post-river arrivals as represented in the DZ ages plots, although they are not exactly matched with the plots of DZ ages.
Some key observations follow:
1) The key DZ age range to identify the exceptional geomorphic history in the study area is at about 18-20 Ma, because the age distribution plot reflecting pre-river arrivals (DZ SRP1) contains larger peaks than the plot reflecting post-river arrivals (DZ SRP2) in this age range. Both histograms of model 1 and model 2 showed this similar tendency (Figure 8). Particularly, the relative probabilities of the peak of model 2 at about 20 Ma and are similar to the relative probabilities of DZ age plots (Figure 8E and G).
2) The pre-river arrival case of model 2 fully reflects empirical DZ ages between 10 Ma and 20 Ma (Figure 8E).
3) The areal distribution of all geological units (model 2) is likely to reflect a variety of small peaks of DZ ages between 400 and 1900 Ma before river arrivals (DZ SRP1), though the relative probabilities of model 2 are much smaller than the probabilities of DZ SRP1.
4) While the results of spatial analysis have substantial matches with the DZ plots in the younger age range (≤20 Ma), histogram peaks in the older age range DZ empirical data do not form a close match with spatially modeled output. A first possible reason for the poor alignment for older DZs could be due to the wide age range of older rock units in geologic map (Table 1). The spatial analysis technique developed in this study inherently simplifies the modeling, because the mid-point age was picked. In reality, the range of ages for any geological unit would produce a range of ages for the DZs. A second possible reason for the poor matches between model and empirical data for the older DZ ages may be based on the poor age constraints of rock units in the geologic map. Practically, it is difficult to date all the rock units to produce geologic map, so geologist often decide the age of geologic units based on relative dating techniques or using correlation to a few radiometric ages, and thus the ages are actually represented as a “range” instead a single age (Table 1). Therefore, when accurate age constraints exist for the various lithologic units, spatial modeling would be able to produce more accurate model results. A third possible reason for the poor alignment of the integrated DZ deposits is that they were collected for a condition ca. 2-2.5 Ma soon after the Salt and Verde rivers integrated. This initial stage of drainage integration often involves the “flushing” or erosion of sediment that had accumulated in upstream basins. Soon after integration, the sediment being deposited in the sampled well could be heavily biased towards these basin-fill deposits. Thus, it is possible that the modern distribution of mapped geological units would not be the proper shape file to compare with the modeled DZ sample for the post-integration condition.
5) In retrospect, the study area selected for testing a spatial analysis method to produce predictive DZ peaks did have the advantage of being able to compare two distinct time periods. However, the study area lacked and still lacks a sufficient degree of chronometric precision and accuracy for the variety of geological units to be a good test of a spatial analysis method. Thus, the next logical test of a spatial analysis approach would be to use DZ results from a much simpler drainage basin – ideally one with perhaps 3-5 igneous rock units, all of which have been thoroughly and accurately dated.
In Korea, the U-Pb ages and age spectra of DZs were used to estimate the provenance of the Hayang Group in the Gyeongsang Basin (Choi and Kwon, 2019), Taean Formation (Han et al., 2017; Choi and Park, 2019) and the late Paleozoic Sadong Formation in the Pyeongchang coalfield (Lee et al., 2010). The spatial analyses presented in this paper could be used for researchers to compare their interpretation of the provenance. In other words, the replicability and reproducibility of the models using PySAL would provide an opportunity for Korean DZ provenance studies to explore the changes of DZ age distributions depending on the possible scenarios of geologic/geomorphic evolutions of their study area and to help determine which scenario would be the best scenario to explain geologic/geomorphic evolutions.
6. Conclusion
“[T]racking detrital-zircon populations along potential dispersal paths is both practical and essential for provenance interpretation, and constitutes a new opportunity for provenance studies and paleogeographic reconstruction.” (Thomas, 2011・304). The broader significance of this research revolves around the need for detrital zircon provenance studies to develop quantitative assessment of detrital zircon provenance. At the present time, the comparison of detrital zircons in sedimentary deposits rests entirely on the qualitative and intuitive expertise of the individual(s) who mapped the geology of the source region. This research demonstrated the power of spatial analyses using PySAL to use mapped distributions of geologic units to produce area-weighted age distribution histograms. This spatial analyses successfully produced distinct age distributions to compare with empirical detrital zircon data for two different drainage evolution stages in central Arizona, USA. One state involved just closed basin geological units contributing zircons to a deposit. The other drainage basin state was a condition of an integrated drainage basin. Although this initial study achieved only a partial success, this success warrants further investigation, because the performance of the analyses is likely to be improved if more accurate age constraints of lithology units are available. Given the potential of this analysis, I anticipate that models developed in this initial study could generate further improved models for quantitative assessment of detrital zircon provenance.
