1. Introduction
2. Data and methodology
1) Study site
2) Data and method
3. Results
1) Inter-annual variability and trends of rice yield
2) Effect of climate variables on growth phases of rice crop
4. Discussion
5. Summary and Conclusion
1. Introduction
The agriculture is the mainstay of the rural economy of Pakistan and plays an essential role in the process of the economic development of the country. Climate disruptions to agriculture has been increasing which has an adverse effect on the crop yield. The Kharif (rainy season) and Rabi (dry season) are the main cropping seasons in Pakistan. The rice crop is the major Kharif crop of the country. Rice crop growth, development and yield are greatly affected by climate elements, including rainfall and temperature. The effects of climate elements are exhibited through crop establishment, number of tillers, crop duration, leaf area and number of panicles that determines the rice yield. The climate elements may also create favorable and unfavorable conditions for the development of diseases.
Numerous studies have attempted to assess the influences of rainfall and temperature on rice plant growth in India (Dubey et al., 2018; Kingra et al., 2018; Bhatt et al., 2019). The rice production is influenced by fluctuation in rainfall during the summer monsoon season in India (Asada and Matsumoto, 2009; Birthal et al., 2014). Kingra et al.(2018) also indicated that spatio-temporal variability of summer monsoon rainfall have an adverse effect on rice crop production. The rice crop was adversely affected by high temperature in the lower elevation of the tropics and low temperature in temperate regions during the various rice growth stages (Sridevi and Chellamuthu, 2015). The rice crop is adversely affected by maximum temperature during the vegetative and reproductive phases. The maximum temperature was attributed to spikelet sterility in rice plant during the flowering stage of the reproductive phase (Dabi and Khanna, 2018). Bhatt et al.(2019) found that rice yield is negatively affected by high minimum temperature at flowering stage.
Similarly, the number of studies have estimated the impacts of rainfall and temperature on rice crop in Pakistan (Mahmood et al., 2012; Haris et al., 2013; Ali et al., 2017; Bokhari et al., 2017). Mehmood et al.(2012) showed that an increase in rainfall during September- October by 5% and 15% may have a negative impact on rice crop in the Punjab, Pakistan. The maximum temperature has a negative and significant effect on rice in the Punjab (Haris et al., 2013). The minimum temperature is indicated a negative and significant effect on rice yield in Pakistan (Ali et al., 2017). Bokhari et al.(2017) stated that increase in minimum and maximum temperature during the Kharif season is negatively influenced the crop in the Punjab, Pakistan. There is no study conducted about the rice growth stages region wise in Punjab, Pakistan.
The Punjab province covers about 69% of the total cropped area of Pakistan. The economy of the Punjab province is mainly agriculture based. The Punjab province is playing a leading role in agricultural production. Rice crop is the second major Kharif crop of the Punjab province. The rice crop contribution is 70.2% in national food production of the Punjab, Pakistan. At present, the agriculture sector of the Punjab is under stress due to climate variability and rising demand for its huge population. Thus, the effects of climate on the rice yield is required to be investigated. Keeping such scenario, the objective of this study is to determine the effects of rainfall and temperature on rice crop growth phases and its various stages in the Punjab province, Pakistan.
2. Data and methodology
1) Study site
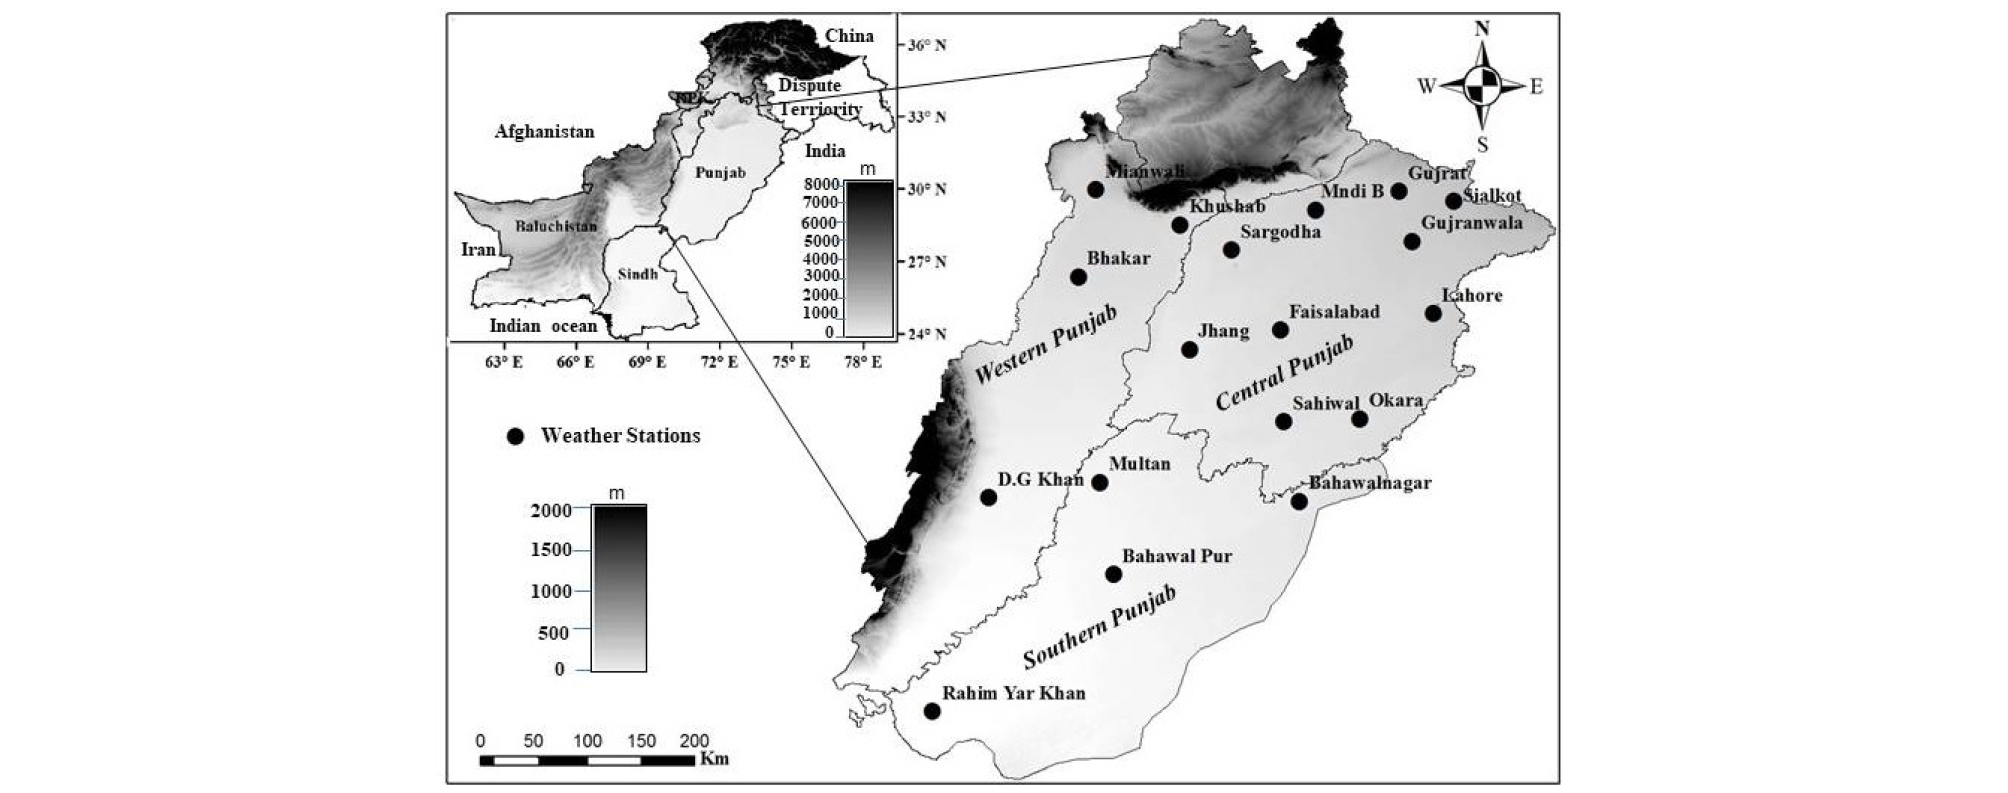
The Punjab province is located between 27° to 34° north and 69° to 75° east as shown in Figure 1. The province has the largest population and is the major agricultural hub, producing above 50% of country agricultural commodities. The Punjab province is divided into four regions; Northern, Central, Southern and the Western regions. These regions are classified on the basis of geographical boundaries, flow of canals and cropping patterns (Cheema et al., 2008; Wilder, 1999). Topographically, Northern and some areas of the Central region are generally categorized by the hills with elevation above 600 m. The Northern region has less cultivated area for crops. The other regions are mainly categorized by the plain areas. This study therefore, has not included the Northern region for estimation of effects on rice crop.
Table 1 enlists a detailed description of the Punjab regions, Pakistan. Rice is the major crop of the Kharif season in the Punjab province. The Kharif season lasts from April-May to October-November. Rice crop largely depends upon the distribution of rainfall during summer monsoon season in the Punjab, Pakistan. The sowing period of Kharif crop is characterized by high maximum temperature and warm nights. Mostly irrigation is supplemented with groundwater pumping. The Central region has 52% irrigated area. The Southern and Western regions have 17% and 31% irrigated area respectively.
Table 1.
Geographical characteristics of classified regions of the Punjab
The Central region is the major rice growing region of the Punjab province. It has an area of 33,524 km2 accounting for 35% of the total province area. Rice crop is cultivated in the 47% area of the Central Punjab. The Southern Punjab is the second largest region, which contributes 31% of the total area. This region has 24% rice cultivated area. The Western region has an area of 59,284 km2 that consists 29% of the Punjab province area. The Kharif rice harvested area is 44% investigated during this study period.
The Central region is dominated by humid subtropical climate. 57.5% rainfall is estimated during the summer monsoon season in this region. The annual rainfall is greater than 700 mm. The annual mean temperature is from 24 to 25°C, with the minimum temperature of 18 to 19°C and maximum temperature of 30 to 31°C. While, Kharif season rainfall and the mean temperature are 534 mm and 31°C, respectively in the Central region.
The annual rainfall of the Southern region is less than 250 mm, which is dominated by the arid climate. Adnan et al.(2017) stated that low rainfall regions which receives less than 250 mm annual rainfall are categorized as the arid region. June and July are the prominent months that reduces the moisture stress. In this region, rainfall during the summer monsoon season accounts for 39.7% of total rainfall. The annual mean temperature varies from 25 to 27°C, with the minimum temperature of 17 to 19°C and maximum temperature of 32 to 34°C. The Kharif season rainfall and the mean temperature are 198 mm and 32°C, respectively in the Southern region.
The Western Punjab is characterized as the subtropical semiarid climate region. In this region, annual rainfall is more than 400 mm. The rainfall is maximum during July and August. The annual mean temperature varies from 24 to 26°C, with the minimum temperature of 17 to 18°C and maximum temperature of 31 to 33°C. The Kharif season rainfall and the mean temperature are 307 mm and 31°C, respectively in the Western region. The climate of the classified Punjab regions is primarily dry in nature with high rainfall variability.
2) Data and method
Monthly mean temperature, maximum temperature, minimum temperature and rainfall data of 18 weather stations were obtained from Pakistan Meteorological Department (PMD) for 30 years (1989-2018). The 10 weather stations are located in the Central Punjab, 4 in the Southern Punjab and remaining 4 stations are situated in the Western Punjab. The data for rice production and cultivated area were obtained from Crop Reporting Service (CRS) Punjab, Pakistan. The crop yield was calculated by dividing production on the cultivated area.
The variation of crop yield is largely driven by climate, but various studies have shown that crop management factors; technology, use of fertilizers, agricultural practices, state policy and advanced cropping methods have contributed to increase the yield of rice in the past decades (Yu et al., 2014). Due to technological differences, it is difficult to estimate the effects of climate from original yield data. Therefore, it is necessary to de-trend the yield data. The first difference method was used to evaluate the effects of climate and effectively remove the influences of external factors such as crop management factors (Wang et al., 2015; Heo and Lee, 2017; Nageswararao et al., 2018). Various studies have indicated that the first difference method and linear de-trend statistical technique has the same approach to reduce the influence of the technological effects on the crop yield. The first difference is defined as the difference between present and previous-year value. The first difference values of the rice yield and climate factors in each region were calculated. The data set obtained from first difference method were used to analyze the effect of rainfall and temperature on rice yield. The first difference data has been also used in plotting the figures.
The correlation coefficients between the rice yield and climate variables were calculated region-wise in the Punjab, Pakistan. The correlation coefficients were obtained using the Pearson’s correlation method. From the correlation analysis, the significant variables were found at 0.01 level. There was no significant variable was found at 0.05 level. Moreover, the stepwise regression method was applied on identified significant correlate elements at a significance level of 0.01. The stepwise regression method is useful to estimate the effects of major climate elements on the crop yield. This method evaluates potential contributions of all elements to crop yield variation and excludes variables which is non significant (Liu et al., 2010). Standardized regression coefficients were taken to assess the contribution of each significant climate variable with rice yield. The standardized regression coefficients were calculated by multiplying the regression coefficient by SXi and dividing it by SY (Nimon and Oswald, 2013). The coefficient value is determined by the expected change in dependent variable Y (in standardized units of SY where each “unit” is a statistical unit equal to one standard deviation) due to change in independent variable Xi with standardized units with all other X variables unchanged. Then the variance inflation factor (VIF) was perceived from the set of stepwise regression variables to determines the multicollinearity. All the variables have the VIF values between 2 and 3. The two variables have the VIF values between 6 and 7 (Table 2). Multicollinearity becomes more serious when the value of VIF is more than 10 (Yoo et al., 2014).
Table 2.
The values of variance inflation factor (VIF) of significant elements
To investigate the pronounced years of high/low rice yield, ±1.5 standard deviation threshold was set for annual yield region wise. The whole rice growing season was categorized into three general growth phases: vegetative, reproductive and ripening (Table 3). The vegetative phase was included the re-plantation, tillering and stem elongation stages. This phase lasted from June to August. The reproductive phase was contained the flowering stage. This is a very critical stage of rice plant growth. This phase was covered in September. The ripening phase was included the milking and harvest stages which were covered in October. Climatologically, this is called as post-monsoon period.
3. Results
1) Inter-annual variability and trends of rice yield
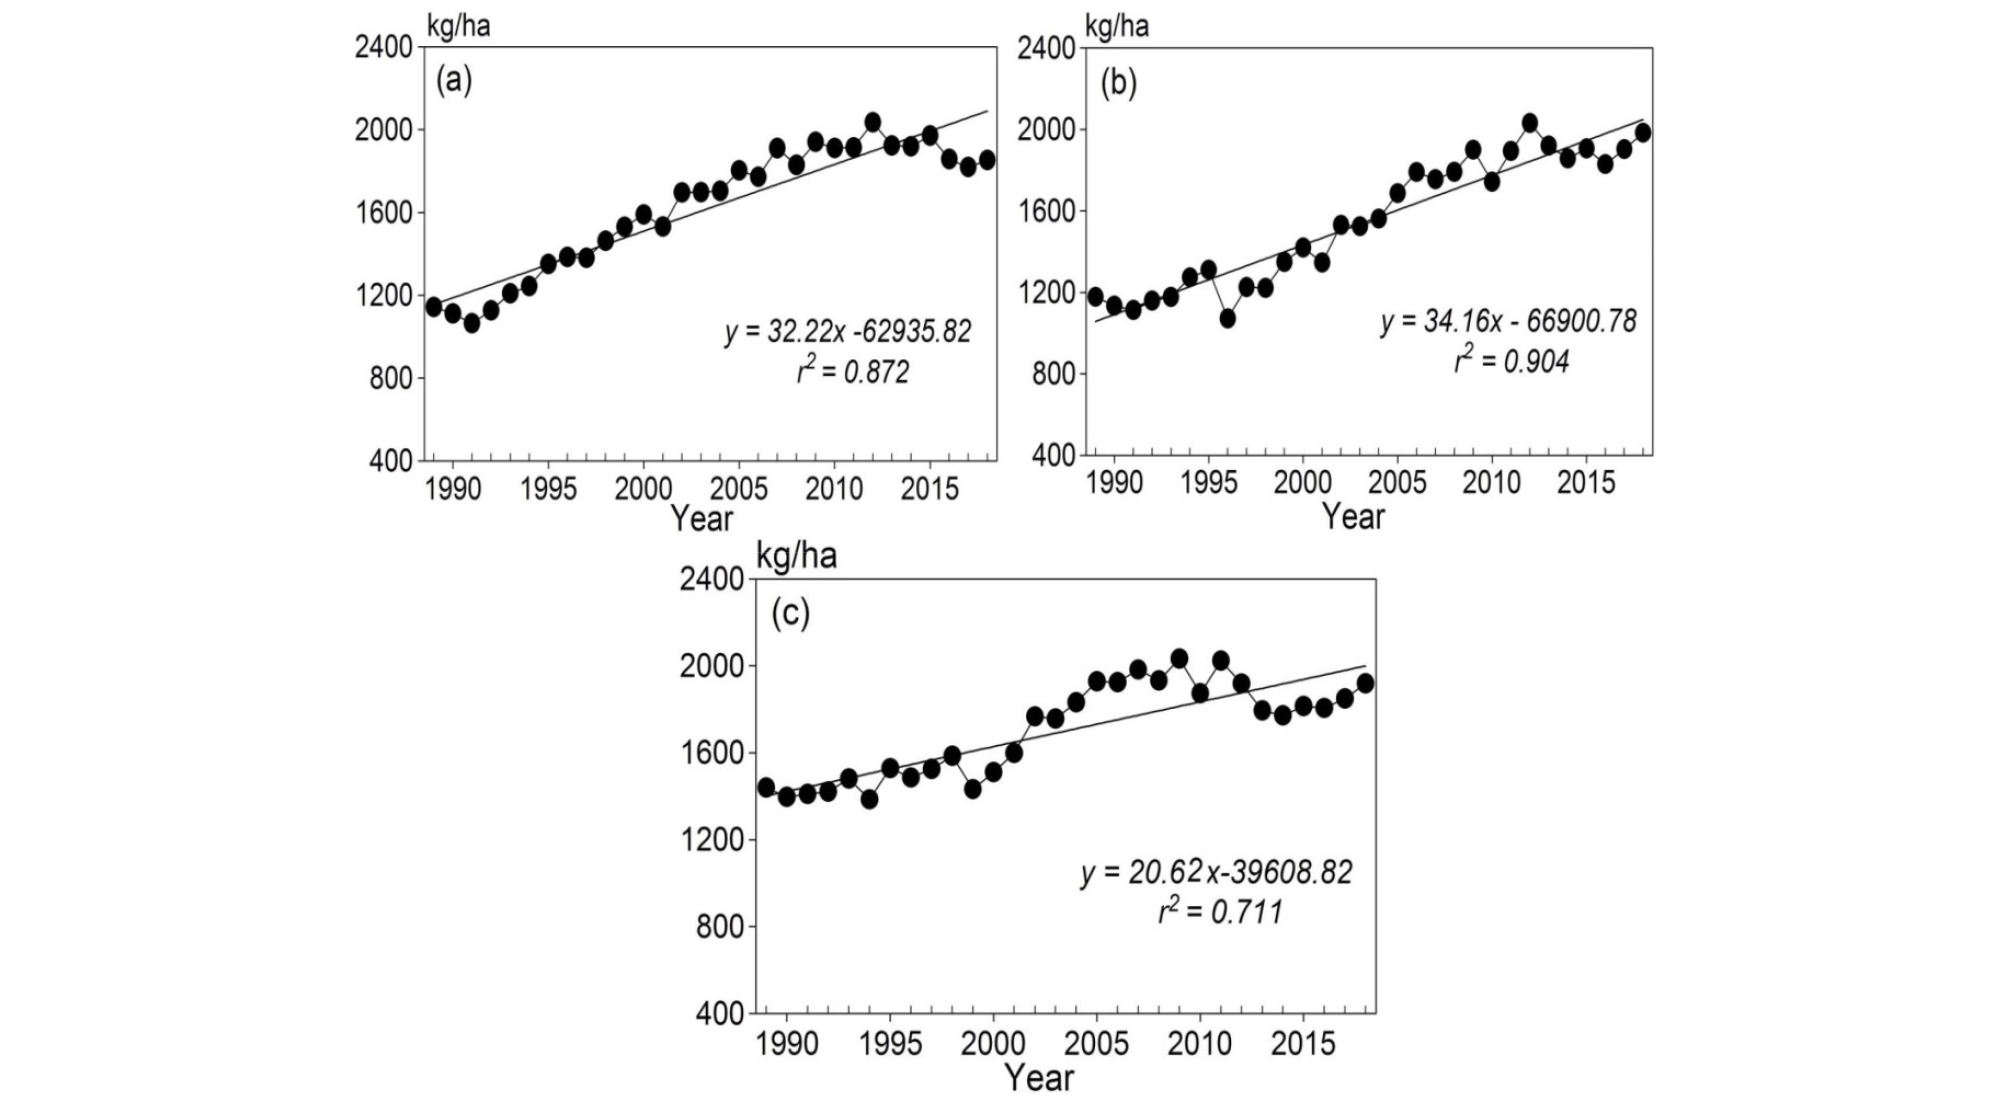
The climate of the Punjab province varies with region to region. The rice yield in all 3 regions varied greatly from year to year (Figure 2). The temporal fluctuation in the rice yield is demonstrated by climate variability. The trend line of rice yield showed a gradual increase in all 3 regions particularly after 2000. The increasing rate of rice yield was 32.22 kg ha–1 yr–1, 34.16 kg ha–1 yr–1 and 20.62 kg ha–1 yr–1 in the Central, Southern and Westerns regions respectively. The r2 values were 0.872, 0.904 and 0.711 for the rice yield in the Central, Southern and Westerns regions respectively. Large variability was found in the Southern region. Whereas, the Western region had a lower amplitude of rice yield variation. In the Central region, the increasing trend of rice yield was calculated during 1991 to 2012. But, the decreasing trend of rice yield was found in the last five years from 2013 to 2018 (Figure 2a).
In the Southern region, the increasing trend of rice yield was seen in 1996 to 2000 with a growth rate of 4.91% per year. Similarly, the upward trend of rice yield was measured during 2000 to 2012 in the Southern Punjab. Despite this, downward trend of rice yield was estimated from 2013 to 2016 (Figure 2b). In the Western region, the high increasing trend of rice yield was demonstrated in 1990 to 2009. During this span, the annual growth rate of 0.89% per year was calculated. Besides, from the analysis, decreasing trend of rice yield was noticed in the last nine years from 2010 to 2018 (Figure 2c). Overall, the high variability of rice yield was found in the Southern region.
2) Effect of climate variables on growth phases of rice crop
Rice is very sensitive crop that depends on the climate conditions. Climate elements such as rainfall and temperature are important for rice growth. The influence of each climate element varies to each growth phase.
(1) Vegetative phase
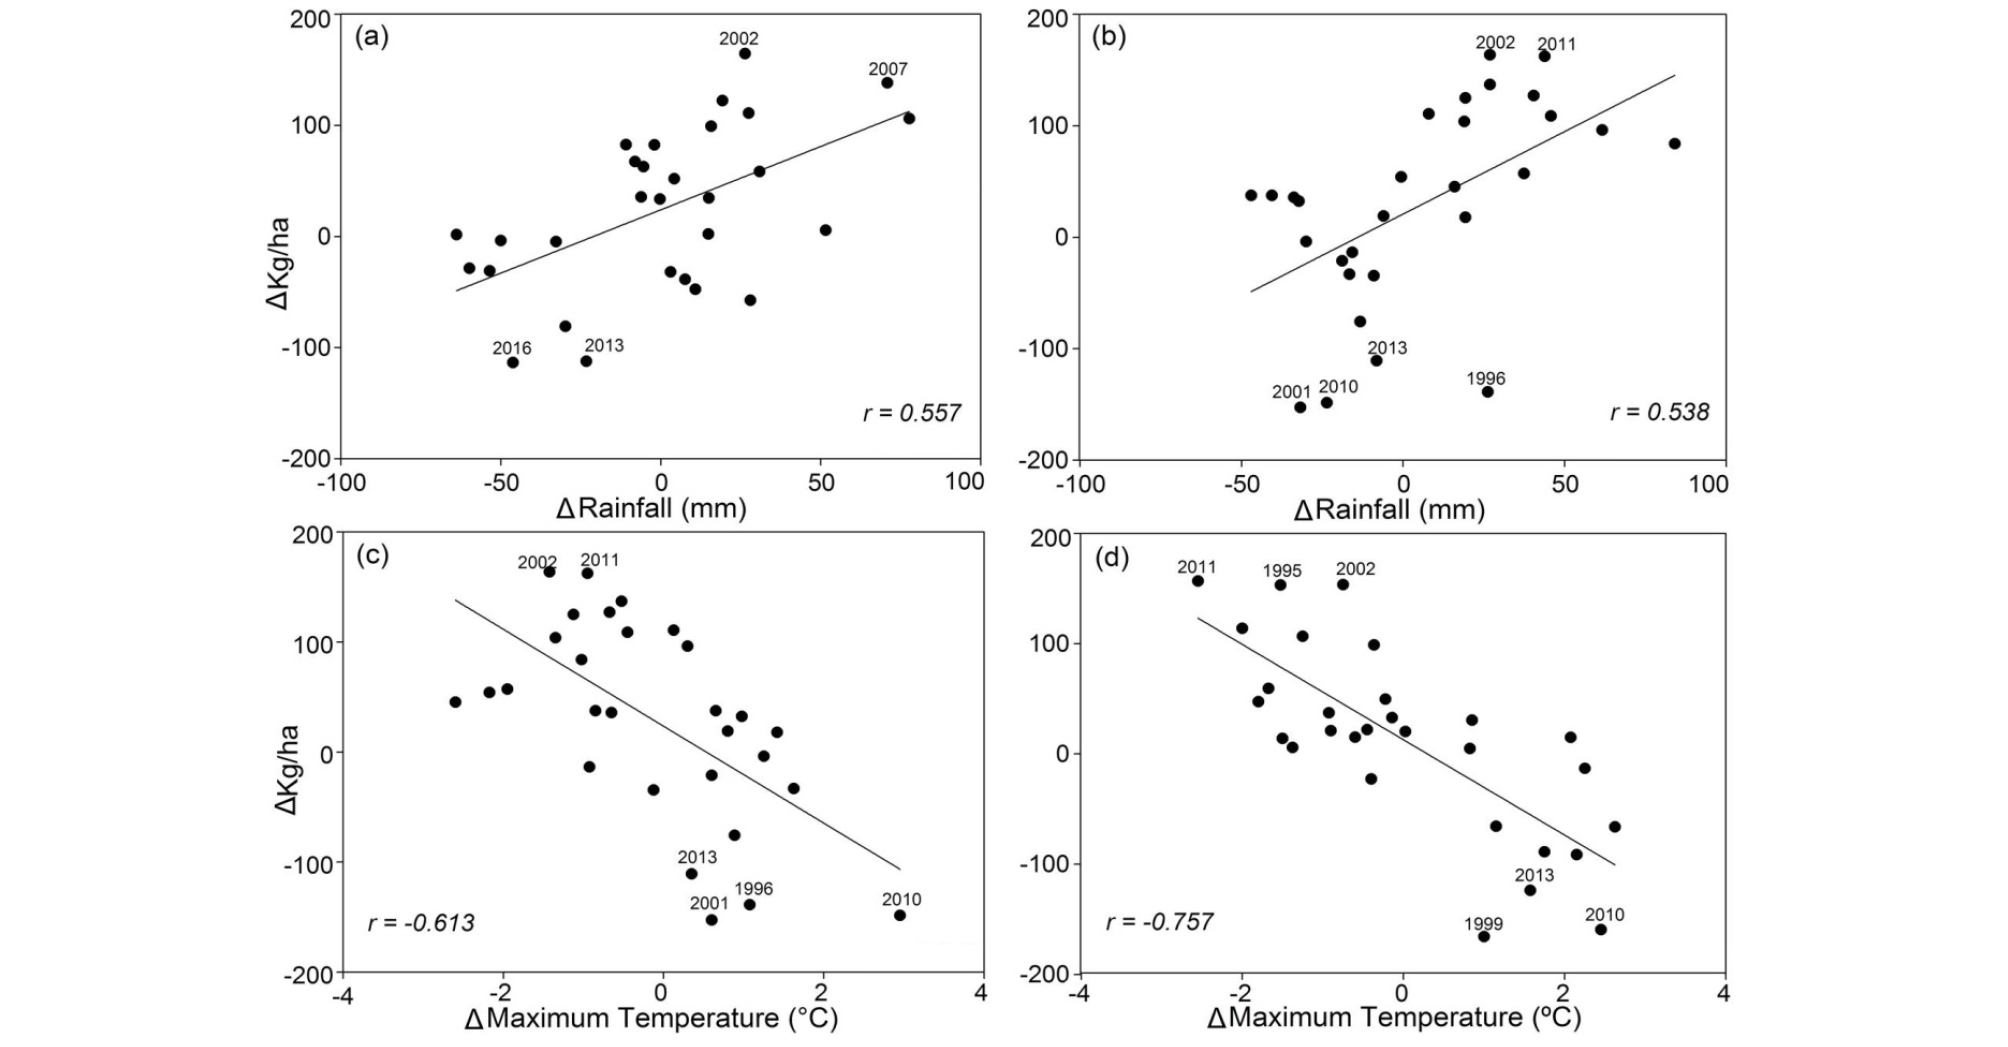
The vegetative phase is included the re-plantation, tillering and stem elongation stages. The rainfall has a significant positive effect on the rice yield during re-plantation stage in the Central region. The rainfall is found more than 100 mm in the high yield year 2002, which is sufficient for the rice plant establishment during the re-plantation stage. While the rainfall in 2013 (70 mm) and in 2016 (68 mm) is less and not sufficient for the rice plant growth and it has a negative relationship to the rice yield during the re-plantation stage in the Central region. The first difference values of this less rainfall have been recorded as -23 mm and -46 mm for 2013 and 2016 respectively (Figure 3a).
The rainfall also showed a significant positive relationship with rice yield in 2002 (118 mm) and in 2011 (110 mm) in the Southern region. The first difference values of rainfall are as 84 mm and 56 mm for 2002 and 2011 respectively. In 2010 (68 mm), 2013 (47mm) and 2016 (37 mm), rainfall has the negative relationship to rice yield during the re-plantation stage in the Southern region (Figure 3b).
The first difference values of less rainfall during the same years are as -24 mm, -8 mm and -13 mm, respectively which are not enough for the rice plant establishment. Consequently, it was caused a negative impact on rice yield during the re-plantation in the Southern region (Figure 3b). The water deficiency during the re-plantation stage have negative effects on rice plant establishment, leaf area and plant growth that reduced the rice yield. The maximum temperature has the negative relationship with rice yield during the re-plantation stage, which caused a negative effect on establishment of rice plant in the Southern region.
The maximum temperature in 2002 and 2011 has a negative relationship to the rice yield in Southern Punjab (Figure 3c). The negative effect of maximum temperature on rice crop was analyzed during the re-plantation stage in the Western region. The maximum temperature in 1999 and 2010 indicates a positive relationship with rice crop which was declined the rice yield during the re-plantation stage in the Western region (Figure 3d).
The minimum temperature also has the negative association to yield of rice crop during the tillering stage in the Central region. The minimum temperature in 2002 negatively impacts the rice crop in the Central region. The high minimum temperature in 2013 and 2016 was indicated the negative effect on rice crop that reduced tillering rate and declined rice yield during the tillering stage in the Central region (Figure 4a). Rainfall had shown the positive effect on the rice plant during tillering stage in the Western Punjab in 1995, 2002 and 2011. While, the negative relationship of rainfall and rice yield was examined in 1999 and 2010 during the tillering stage in the Western Punjab (Figure 4b).
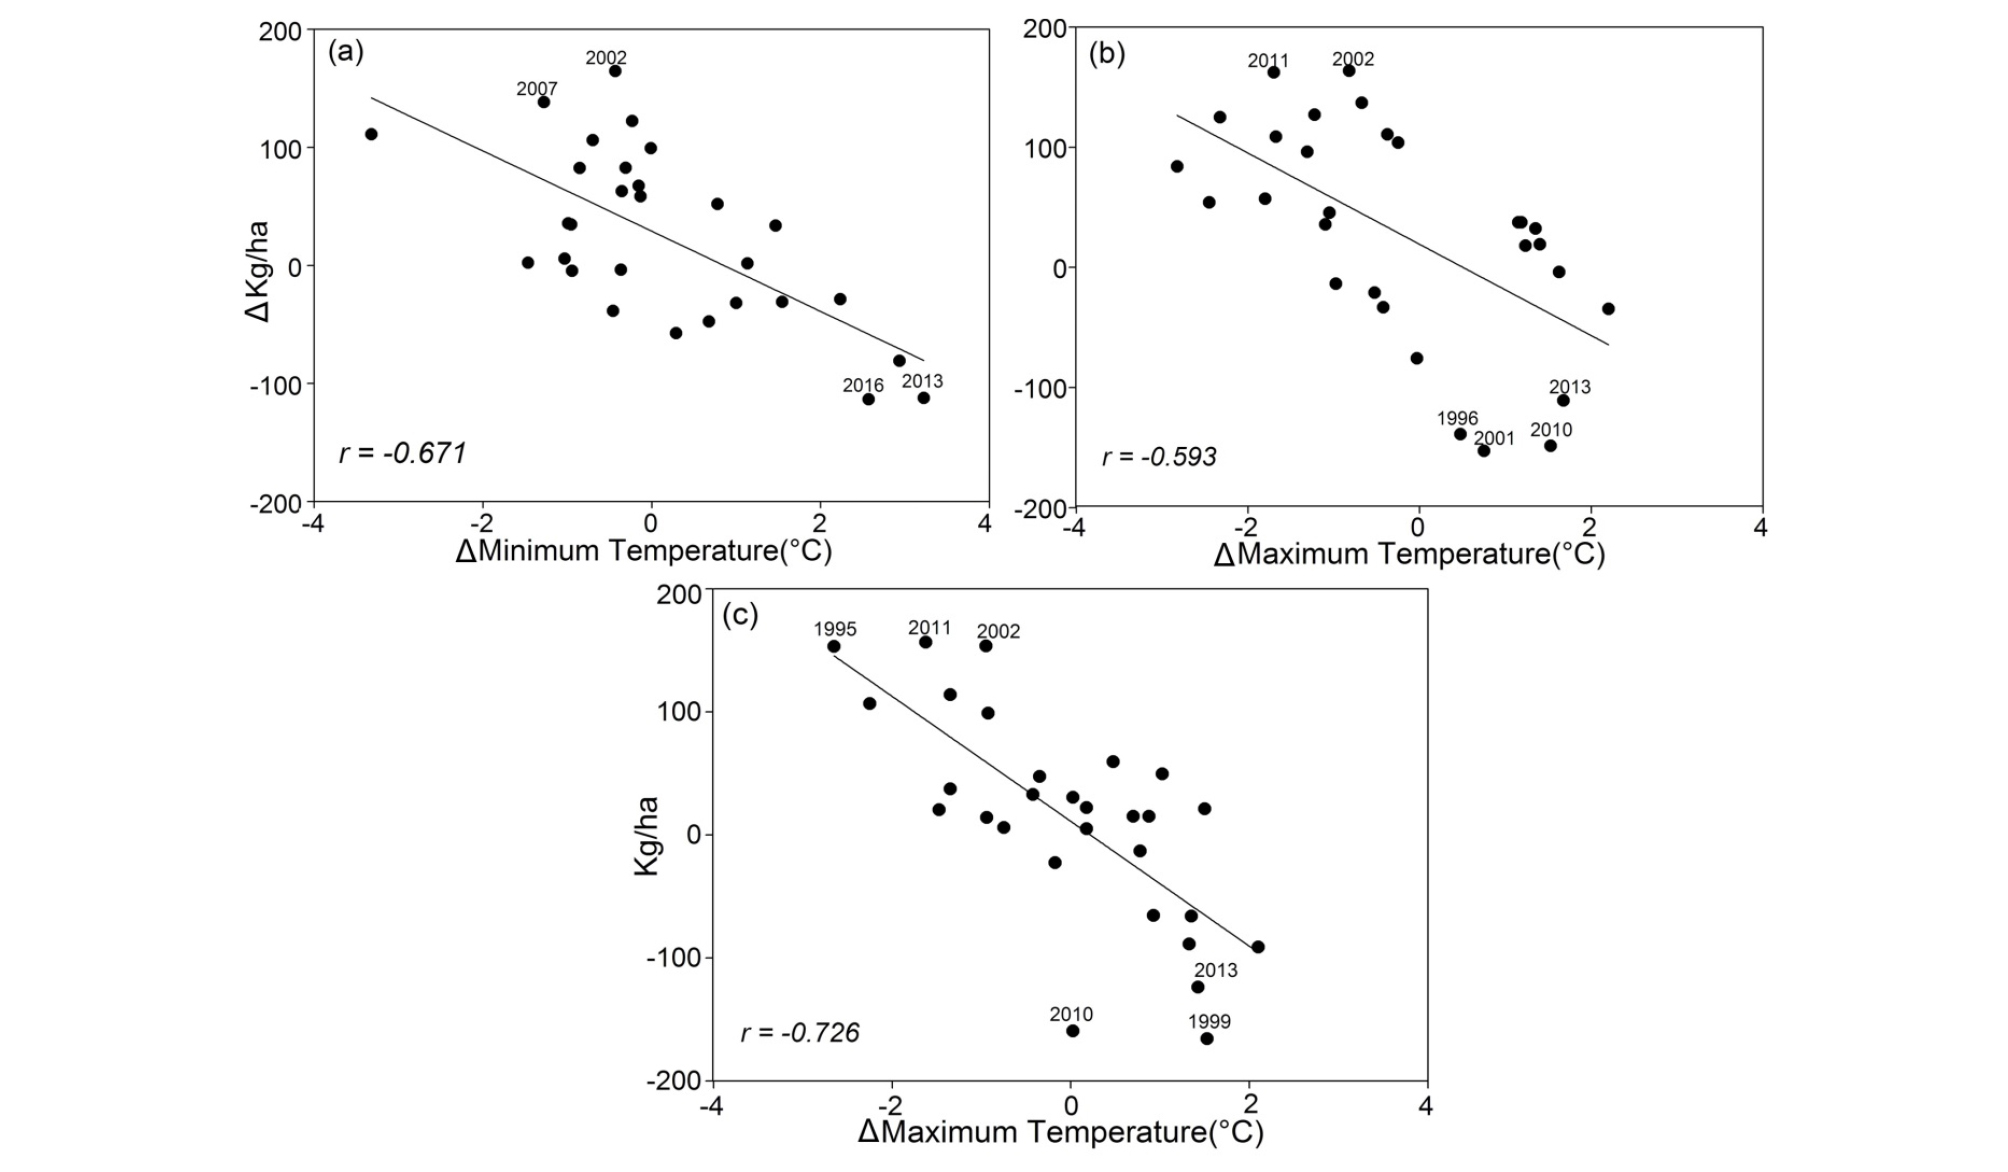
The minimum temperature is showed the negative association with rice yield at the stem elongation stage in the Central region (Figure 5a). The low minimum temperature has a significant negative effect on rice yield in 2002. The high minimum temperature has a negative effect on the leaf area and growth of rice period during the stem elongation stage in the Central region in 2013. The minimum temperature was also indicated the negative effect on rice crop in the stem elongation stage in the Southern Punjab in 1996 and 2001 (Figure 5b).
(2) Reproductive phase
The flowering stage is sensitive to climate during the reproductive phase. The minimum temperature has a significant negative effect on the rice yield at flowering stage in the Central region (Figure 6a). The high minimum temperature was negatively affected the period of rice growth that declines the rice yield during the flowering stage. In addition, the rice crop is negatively affected by maximum temperature during the flowering stage in the Southern Punjab (Figure 6b). The high maximum temperature is indicated the negative effect on the weight of grain and duration of grain filling which reduces the rice yield at flowering stage in 2010 and 2013. The significant negative effect of the maximum temperature to rice yield is also investigated during the flowering stage (Figure 6c). The low yield in 1999 and 2013 were affected by high maximum temperature at flowering stage in the Western Punjab.
The ripening phase was included the milking and harvesting stages. The high maximum temperature at milking and harvesting stages have a negative impact on the rice plant. The maximum temperature is caused the spikelet sterility which decreases the weight of rice crop. There is no significant relationship between rice yield and climate during the ripening phase.
4. Discussion
In order to investigate the effects of climate during various rice growth stages, correlation values were obtained using the correlation method. The significant correlate climate elements to rice yield were given in the Table 4.
Table 4.
Correlation of climate parameters with rice yield in various phases and stages of rice crop
Stepwise multiple regression was computed to access the effects of climate on rice yield and the partial distribution of climate variables during the various rice growing stages were discussed. Three equations with Central, Southern and Western regions were calculated to find the partial contribution of significant climate variables to rice yield. Rice yield and climate relationship during rice growth stages is mentioned below;
In above equations, Tn(7) is minimum temperature in July, Tn(9) is minimum temperature in September, Tx(6) is maximum temperature in June, Rn(6) is rainfall in June, and Tx(9) is maximum temperature in September. In the Central region, the standardized regression coefficients for minimum temperature is found as 0.54 and 0.34 at the tillering and flowering stages respectively in Eq. (1). Comparatively, the minimum temperature in July has more negative impact on the rice yield. The high minimum temperature decreases the range of diurnal temperature, which is reduced the duration of tillering and increased tillering rate. This exhibits the negative effect on rice yield at the tillering stage. Moreover, minimum temperature above normal has caused poor rice plant growth, decrease in photosynthetic rate and increase in respiration rate that reduces the rice yield during the flowering stage (Sridevi and Chellamuthu, 2015). In the Southern region, the maximum temperature has as 0.47 standardized coefficients in Eq. (2), which has more influence as compared to rainfall (0.35) during the re-plantation stage. The high maximum temperature has a negative effect on the establishment of rice plant which decreased the number of rice plants during the re-plantation stage in the Southern region.
Rainfall is indicated the significant positive effect on rice yield, which is related to the less irrigated area (17%) in the Southern region as compared to the Central (52%) and the Western (31%) regions. The water supply for crops depend on rainfall due to less irrigation, which make it significant in the re-plantation period. Generally, Summer monsoon rainfall is the main source of rainfall in Punjab, Pakistan. The monsoon from the Bay of Bengal moves towards the north and east blocked by Assam hills in India. Monsoon topographically lifts and then gives moisture to Cherrapunji and moves towards the west into the mainland of Indus-Ganga plain. As they move towards the west, their moisture content gets lesser and lesser (Hussain and Lee, 2009). Thus, the rainfall in June has a positive relationship to rice yield in the Central and Southern regions and rainfall in July indicated a positive relationship with rice yield in the Western region.
In the Western region, the standardized coefficient values were as 0.49 and 0.40 for the maximum temperature for the re-plantation and flowering stages respectively in Eq. (3). It is assessed that high maximum temperature has a negative influence on the rice crop at the re-plantation stage. The high maximum temperature has the negative impact on rice plant which increases the spikelet sterility and reduced the rice yield in the flowering stage (Bhatt et al., 2019). The maximum temperature is estimated high in the Southern and Western regions as compared to the Central region. Khan et al.(2019) confirmed that the maximum temperature is increased significantly in the plain areas of the Punjab.
5. Summary and Conclusion
This study explored the effects of climate on rice crop in the Punjab province of Pakistan with an average monthly mean, maximum, minimum temperature and rainfall data in each specific region for the period of 1989-2018. The correlation coefficients between the rice yield and climate variables were employed to define the effects of climate on rice yield. The standardized regression coefficients from the stepwise regression were calculated to detect the more considerable effect of climate elements on the rice crop.
The effects of climate elements on rice yield was estimated significant in the Punjab, province Pakistan. It is evident that the region of Southern Punjab exhibited higher rates of yield increase 34.16 kg ha–1 yr–1 as compared to the Central and Western regions. It is documented that the maximum and minimum temperatures were increased during the Kharif season in the investigated regions. Especially in the Central region, the minimum temperature was more fluctuated than the maximum temperature. The minimum temperature was above normal during the tillering and stem elongation stages that caused the decline of rice crop yield in the Central region. The Southern and Western regions were influenced by the higher maximum temperature. The maximum temperature above normal were showed the negative impacts of the rice plant establishment, spikelet sterility and grain weight that reduced the yield of rice during the re-plantation and flowering stage. In addition, rainfall indicated a significant positive impact on rice yield during the re-plantation stage in the Southern region. The Southern region has a less irrigated area in the Punjab province. The water scarcity due to less irrigation is fulfilled by the rainfall. The Central and Western regions have more irrigated area as compared to the Southern region.
From the current study observations, it is evident that the climate effects on the rice yield varied spatially in specified regions of the Punjab. The effects of climate elements to rice yield varied region to region and it requires regional specific policies for sustaining Kharif crop production. Presently, the Punjab regions are suffering from large fluctuations in rainfall pattern and temperature. Such variations in rainfall and temperature are increased the problem of water requirements under warming situations. This study gives a sign for farmers to introduce the advanced agricultural practices and new varieties of rice crop that is more productive at high temperature condition. Furthermore, the farmers may adopt well managed agronomic practices to bring up the high yield under unfavorable climatic conditions. Nevertheless, further investigations are required to estimate the effects of local climatology on the crops in the classified region of Punjab, Pakistan.


